
 Yahoo Finance
 UCB SA's Dividend Analysis
Assessing the Upcoming Dividend and Historical Performance of UCB SA
UCB SA (UCBJY) recently announced a dividend of $0.73 per share, payable on 2024-05-15, with the ex-dividend date set for 2024-04-26. As investors look forward to this upcoming payment, the spotlight also shines on the company's dividend history, yield, and growth rates. Using the data from GuruFocus, let's look into UCB SA's dividend performance and assess its sustainability.
What Does UCB SA Do?
This Powerful Chart Made Peter Lynch 29% A Year For 13 Years
How to calculate the intrinsic value of a stock?
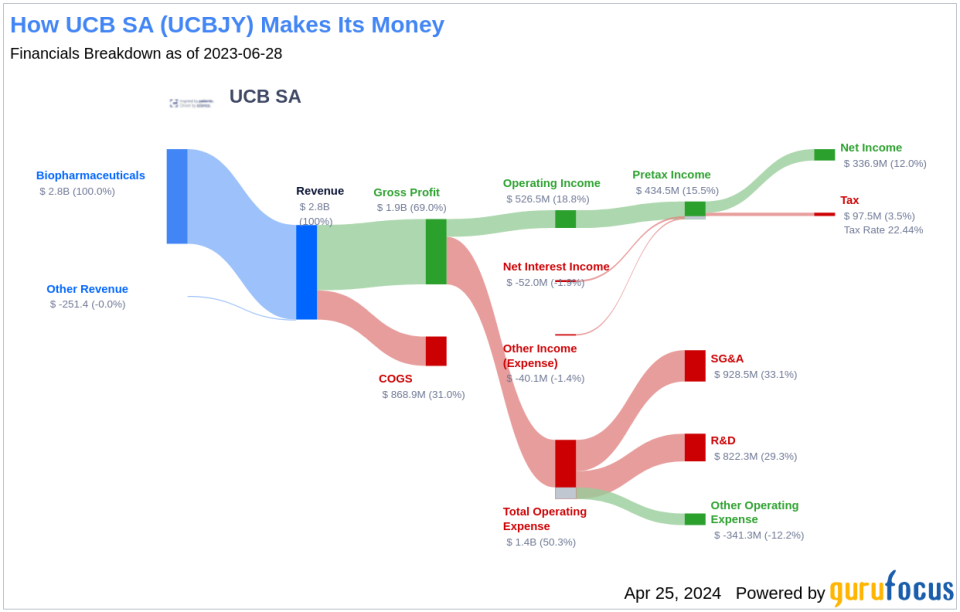
UCB is a Belgium-based biopharma firm focused on the development of novel therapies for the treatment of central nervous system and immunologic diseases. Historically, revenue was derived from allergy medicine Zyrtec and epilepsy drug Keppra, which have both lost patent protection. The firm's key products are Cimzia (immunology), Vimpat (epilepsy), Neupro (Parkinson's disease and restless leg syndrome), Briviact (epilepsy), Bimzelx (psoriasis), Evenity (osteoporosis), Nayzilam (cluster seizures), and Fintepla (Dravet Syndrome and Lennox-Gastaut Syndrome).
A Glimpse at UCB SA's Dividend History
UCB SA has maintained a consistent dividend payment record since 2011. Dividends are currently distributed on a yearly basis. UCB SA has increased its dividend each year since 2011. The stock is thus listed as a dividend achiever, an honor that is given to companies that have increased their dividend each year for at least the past 13 years. Below is a chart showing annual Dividends Per Share for tracking historical trends.
Breaking Down UCB SA's Dividend Yield and Growth
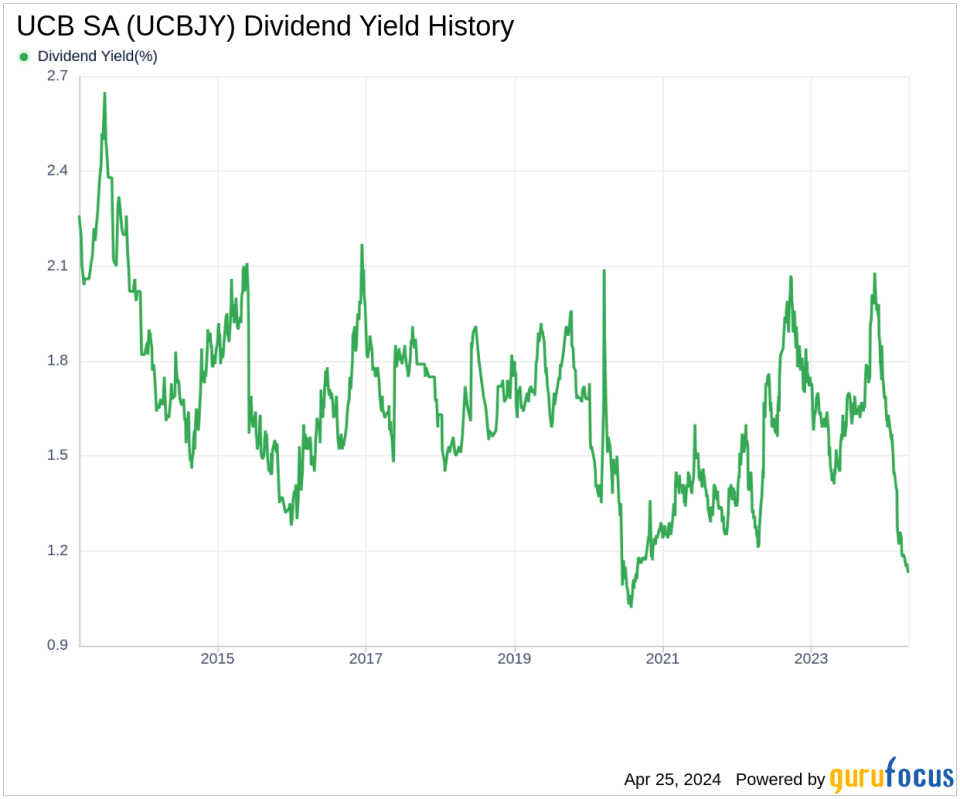
As of today, UCB SA currently has a 12-month trailing dividend yield of 1.13% and a 12-month forward dividend yield of 1.12%. This suggests an expectation of decreased dividend payments over the next 12 months. UCB SA's dividend yield of 1.13% is near a 10-year low and underperforms 61.33% of global competitors in the Biotechnology industry, suggesting that the company's dividend yield may not be a compelling proposition for income investors.
Over the past three years, UCB SA's annual dividend growth rate was 2.40%. Extended to a five-year horizon, this rate stayed the same. And over the past decade, UCB SA's annual dividends per share growth rate stands at 2.80%. Based on UCB SA's dividend yield and five-year growth rate, the 5-year yield on cost of UCB SA stock as of today is approximately 1.27%.
The Sustainability Question: Payout Ratio and Profitability
To assess the sustainability of the dividend, one needs to evaluate the company's payout ratio. The dividend payout ratio provides insights into the portion of earnings the company distributes as dividends. A lower ratio suggests that the company retains a significant part of its earnings, thereby ensuring the availability of funds for future growth and unexpected downturns. As of 2023-12-31, UCB SA's dividend payout ratio is 0.75. And this may suggest that the company's dividend may not be sustainable.
UCB SA's profitability rank, offers an understanding of the company's earnings prowess relative to its peers. GuruFocus ranks UCB SA's profitability 7 out of 10 as of 2023-12-31, suggesting good profitability prospects. The company has reported positive net income for each of year over the past decade, further solidifying its high profitability.
Growth Metrics: The Future Outlook
To ensure the sustainability of dividends, a company must have robust growth metrics. UCB SA's growth rank of 7 out of 10 suggests that the company's growth trajectory is good relative to its competitors.
Revenue is the lifeblood of any company, and UCB SA's revenue per share, combined with the 3-year revenue growth rate, indicates a strong revenue model. UCB SA's revenue has increased by approximately -0.80% per year on average, a rate that underperforms approximately 59.35% of global competitors.
The company's 3-year EPS growth rate showcases its capability to grow its earnings, a critical component for sustaining dividends in the long run. During the past three years, UCB SA's earnings increased by approximately -25.40% per year on average, a rate that underperforms approximately 79.77% of global competitors.
Lastly, the company's 5-year EBITDA growth rate of -27.60%, which underperforms approximately 88.73% of global competitors.
Next Steps
In conclusion, while UCB SA's upcoming dividend payment may attract investor attention, a deeper dive into the company's dividend history, yield, and growth rates reveals areas of concern. The dividend growth rate has remained consistent, but the yield is at a 10-year low and not competitive within the biotechnology industry. Moreover, the sustainability of UCB SA's dividends may be questionable given the high payout ratio, mixed profitability, and growth metrics that suggest underperformance in key areas. Investors should weigh these factors carefully and consider the company's long-term potential when evaluating UCB SA as a dividend investment. For those seeking high-dividend yield stocks, GuruFocus Premium users can utilize the High Dividend Yield Screener for more options.
This article, generated by GuruFocus, is designed to provide general insights and is not tailored financial advice. Our commentary is rooted in historical data and analyst projections, utilizing an impartial methodology, and is not intended to serve as specific investment guidance. It does not formulate a recommendation to purchase or divest any stock and does not consider individual investment objectives or financial circumstances. Our objective is to deliver long-term, fundamental data-driven analysis. Be aware that our analysis might not incorporate the most recent, price-sensitive company announcements or qualitative information. GuruFocus holds no position in the stocks mentioned herein.
This article first appeared on GuruFocus.
