
 Yahoo Finance
 TP ICAP Group's (LON:TCAP) Shareholders Will Receive A Bigger Dividend Than Last Year
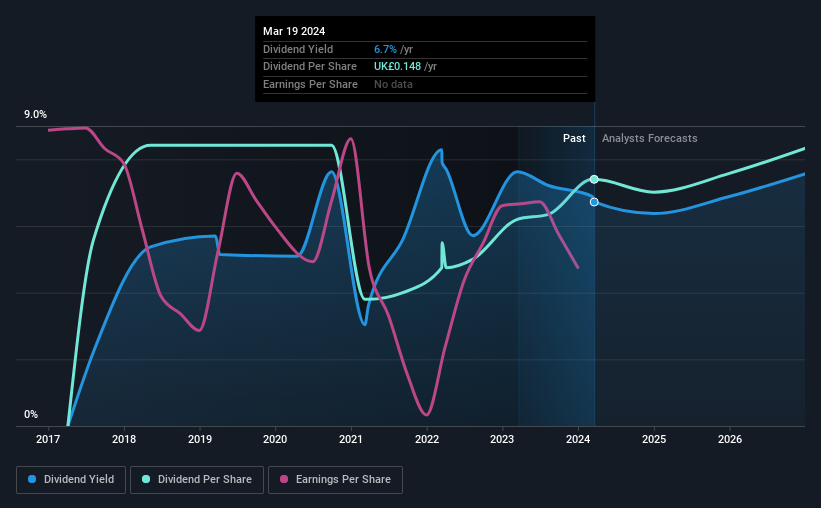
The board of TP ICAP Group PLC (LON:TCAP) has announced that it will be paying its dividend of £0.10 on the 24th of May, an increased payment from last year's comparable dividend. This will take the annual payment to 6.7% of the stock price, which is above what most companies in the industry pay.
See our latest analysis for TP ICAP Group
TP ICAP Group's Earnings Easily Cover The Distributions
If the payments aren't sustainable, a high yield for a few years won't matter that much. Prior to this announcement, the company was paying out 156% of what it was earning, however the dividend was quite comfortably covered by free cash flows at a cash payout ratio of only 53%. Given that the dividend is a cash outflow, we think that cash is more important than accounting measures of profit when assessing the dividend, so this is a mitigating factor.
The next year is set to see EPS grow by 182.7%. Assuming the dividend continues along the course it has been charting recently, our estimates show the payout ratio being 48% which brings it into quite a comfortable range.
TP ICAP Group's Dividend Has Lacked Consistency
It's comforting to see that TP ICAP Group has been paying a dividend for a number of years now, however it has been cut at least once in that time. This makes us cautious about the consistency of the dividend over a full economic cycle. The annual payment during the last 7 years was £0.112 in 2017, and the most recent fiscal year payment was £0.148. This works out to be a compound annual growth rate (CAGR) of approximately 4.1% a year over that time. Modest growth in the dividend is good to see, but we think this is offset by historical cuts to the payments. It is hard to live on a dividend income if the company's earnings are not consistent.
TP ICAP Group Might Find It Hard To Grow Its Dividend
Growing earnings per share could be a mitigating factor when considering the past fluctuations in the dividend. TP ICAP Group has impressed us by growing EPS at 11% per year over the past five years. However, the company isn't reinvesting a lot back into the business, so we would expect the growth rate to slow down somewhat in the future.
In Summary
Overall, we always like to see the dividend being raised, but we don't think TP ICAP Group will make a great income stock. The payments haven't been particularly stable and we don't see huge growth potential, but with the dividend well covered by cash flows it could prove to be reliable over the short term. Overall, we don't think this company has the makings of a good income stock.
It's important to note that companies having a consistent dividend policy will generate greater investor confidence than those having an erratic one. However, there are other things to consider for investors when analysing stock performance. For instance, we've picked out 3 warning signs for TP ICAP Group that investors should take into consideration. Looking for more high-yielding dividend ideas? Try our collection of strong dividend payers.
Have feedback on this article? Concerned about the content? Get in touch with us directly. Alternatively, email editorial-team (at) simplywallst.com.
This article by Simply Wall St is general in nature. We provide commentary based on historical data and analyst forecasts only using an unbiased methodology and our articles are not intended to be financial advice. It does not constitute a recommendation to buy or sell any stock, and does not take account of your objectives, or your financial situation. We aim to bring you long-term focused analysis driven by fundamental data. Note that our analysis may not factor in the latest price-sensitive company announcements or qualitative material. Simply Wall St has no position in any stocks mentioned.
