
 Yahoo Finance
 Those who invested in Parsons (NYSE:PSN) five years ago are up 158%
When you buy a stock there is always a possibility that it could drop 100%. But on the bright side, you can make far more than 100% on a really good stock. Long term Parsons Corporation (NYSE:PSN) shareholders would be well aware of this, since the stock is up 158% in five years. It's also good to see the share price up 18% over the last quarter. This could be related to the recent financial results, released recently - you can catch up on the most recent data by reading our company report.
With that in mind, it's worth seeing if the company's underlying fundamentals have been the driver of long term performance, or if there are some discrepancies.
View our latest analysis for Parsons
To paraphrase Benjamin Graham: Over the short term the market is a voting machine, but over the long term it's a weighing machine. By comparing earnings per share (EPS) and share price changes over time, we can get a feel for how investor attitudes to a company have morphed over time.
Parsons' earnings per share are down 37% per year, despite strong share price performance over five years.
Essentially, it doesn't seem likely that investors are focused on EPS. Because earnings per share don't seem to match up with the share price, we'll take a look at other metrics instead.
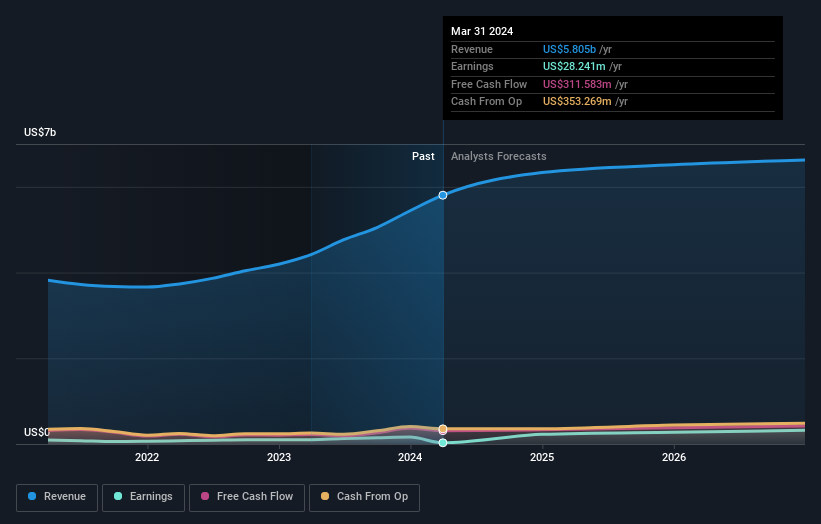
In contrast revenue growth of 6.8% per year is probably viewed as evidence that Parsons is growing, a real positive. In that case, the company may be sacrificing current earnings per share to drive growth.
The image below shows how earnings and revenue have tracked over time (if you click on the image you can see greater detail).
Parsons is a well known stock, with plenty of analyst coverage, suggesting some visibility into future growth. So it makes a lot of sense to check out what analysts think Parsons will earn in the future (free analyst consensus estimates)
A Different Perspective
We're pleased to report that Parsons shareholders have received a total shareholder return of 76% over one year. Since the one-year TSR is better than the five-year TSR (the latter coming in at 21% per year), it would seem that the stock's performance has improved in recent times. Given the share price momentum remains strong, it might be worth taking a closer look at the stock, lest you miss an opportunity. It's always interesting to track share price performance over the longer term. But to understand Parsons better, we need to consider many other factors. To that end, you should be aware of the 2 warning signs we've spotted with Parsons .
We will like Parsons better if we see some big insider buys. While we wait, check out this free list of growing companies with considerable, recent, insider buying.
Please note, the market returns quoted in this article reflect the market weighted average returns of stocks that currently trade on American exchanges.
Have feedback on this article? Concerned about the content? Get in touch with us directly. Alternatively, email editorial-team (at) simplywallst.com.
This article by Simply Wall St is general in nature. We provide commentary based on historical data and analyst forecasts only using an unbiased methodology and our articles are not intended to be financial advice. It does not constitute a recommendation to buy or sell any stock, and does not take account of your objectives, or your financial situation. We aim to bring you long-term focused analysis driven by fundamental data. Note that our analysis may not factor in the latest price-sensitive company announcements or qualitative material. Simply Wall St has no position in any stocks mentioned.
