
 Yahoo Finance
 There's Been No Shortage Of Growth Recently For Samudera Shipping Line's (SGX:S56) Returns On Capital
If you're not sure where to start when looking for the next multi-bagger, there are a few key trends you should keep an eye out for. Typically, we'll want to notice a trend of growing return on capital employed (ROCE) and alongside that, an expanding base of capital employed. If you see this, it typically means it's a company with a great business model and plenty of profitable reinvestment opportunities. So on that note, Samudera Shipping Line (SGX:S56) looks quite promising in regards to its trends of return on capital.
Understanding Return On Capital Employed (ROCE)
Just to clarify if you're unsure, ROCE is a metric for evaluating how much pre-tax income (in percentage terms) a company earns on the capital invested in its business. To calculate this metric for Samudera Shipping Line, this is the formula:
Return on Capital Employed = Earnings Before Interest and Tax (EBIT) ÷ (Total Assets - Current Liabilities)
0.12 = US$90m ÷ (US$910m - US$141m) (Based on the trailing twelve months to December 2023).
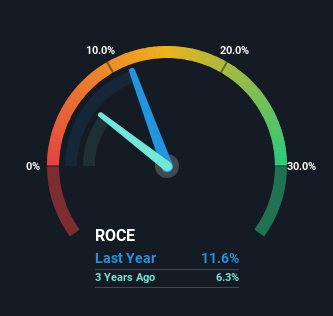
Thus, Samudera Shipping Line has an ROCE of 12%. On its own, that's a standard return, however it's much better than the 6.9% generated by the Shipping industry.
View our latest analysis for Samudera Shipping Line
While the past is not representative of the future, it can be helpful to know how a company has performed historically, which is why we have this chart above. If you're interested in investigating Samudera Shipping Line's past further, check out this free graph covering Samudera Shipping Line's past earnings, revenue and cash flow.
What Can We Tell From Samudera Shipping Line's ROCE Trend?
Samudera Shipping Line is displaying some positive trends. Over the last five years, returns on capital employed have risen substantially to 12%. The company is effectively making more money per dollar of capital used, and it's worth noting that the amount of capital has increased too, by 237%. This can indicate that there's plenty of opportunities to invest capital internally and at ever higher rates, a combination that's common among multi-baggers.
Our Take On Samudera Shipping Line's ROCE
In summary, it's great to see that Samudera Shipping Line can compound returns by consistently reinvesting capital at increasing rates of return, because these are some of the key ingredients of those highly sought after multi-baggers. And a remarkable 806% total return over the last five years tells us that investors are expecting more good things to come in the future. With that being said, we still think the promising fundamentals mean the company deserves some further due diligence.
If you want to continue researching Samudera Shipping Line, you might be interested to know about the 2 warning signs that our analysis has discovered.
While Samudera Shipping Line isn't earning the highest return, check out this free list of companies that are earning high returns on equity with solid balance sheets.
Have feedback on this article? Concerned about the content? Get in touch with us directly. Alternatively, email editorial-team (at) simplywallst.com.
This article by Simply Wall St is general in nature. We provide commentary based on historical data and analyst forecasts only using an unbiased methodology and our articles are not intended to be financial advice. It does not constitute a recommendation to buy or sell any stock, and does not take account of your objectives, or your financial situation. We aim to bring you long-term focused analysis driven by fundamental data. Note that our analysis may not factor in the latest price-sensitive company announcements or qualitative material. Simply Wall St has no position in any stocks mentioned.
