
 Yahoo Finance
 There's Been No Shortage Of Growth Recently For Himax Technologies' (NASDAQ:HIMX) Returns On Capital
What are the early trends we should look for to identify a stock that could multiply in value over the long term? Typically, we'll want to notice a trend of growing return on capital employed (ROCE) and alongside that, an expanding base of capital employed. If you see this, it typically means it's a company with a great business model and plenty of profitable reinvestment opportunities. So on that note, Himax Technologies (NASDAQ:HIMX) looks quite promising in regards to its trends of return on capital.
Understanding Return On Capital Employed (ROCE)
For those that aren't sure what ROCE is, it measures the amount of pre-tax profits a company can generate from the capital employed in its business. The formula for this calculation on Himax Technologies is:
Return on Capital Employed = Earnings Before Interest and Tax (EBIT) ÷ (Total Assets - Current Liabilities)
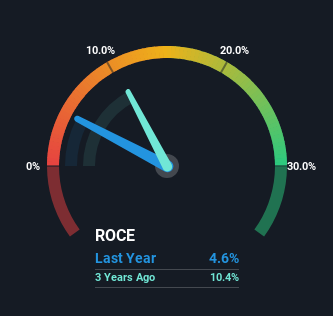
0.046 = US$43m ÷ (US$1.6b - US$709m) (Based on the trailing twelve months to December 2023).
So, Himax Technologies has an ROCE of 4.6%. Ultimately, that's a low return and it under-performs the Semiconductor industry average of 10.0%.
View our latest analysis for Himax Technologies
Above you can see how the current ROCE for Himax Technologies compares to its prior returns on capital, but there's only so much you can tell from the past. If you'd like, you can check out the forecasts from the analysts covering Himax Technologies for free.
What Does the ROCE Trend For Himax Technologies Tell Us?
While in absolute terms it isn't a high ROCE, it's promising to see that it has been moving in the right direction. Over the last five years, returns on capital employed have risen substantially to 4.6%. The amount of capital employed has increased too, by 110%. So we're very much inspired by what we're seeing at Himax Technologies thanks to its ability to profitably reinvest capital.
Another thing to note, Himax Technologies has a high ratio of current liabilities to total assets of 43%. This can bring about some risks because the company is basically operating with a rather large reliance on its suppliers or other sorts of short-term creditors. While it's not necessarily a bad thing, it can be beneficial if this ratio is lower.
The Key Takeaway
A company that is growing its returns on capital and can consistently reinvest in itself is a highly sought after trait, and that's what Himax Technologies has. And with the stock having performed exceptionally well over the last five years, these patterns are being accounted for by investors. In light of that, we think it's worth looking further into this stock because if Himax Technologies can keep these trends up, it could have a bright future ahead.
On a separate note, we've found 2 warning signs for Himax Technologies you'll probably want to know about.
For those who like to invest in solid companies, check out this free list of companies with solid balance sheets and high returns on equity.
Have feedback on this article? Concerned about the content? Get in touch with us directly. Alternatively, email editorial-team (at) simplywallst.com.
This article by Simply Wall St is general in nature. We provide commentary based on historical data and analyst forecasts only using an unbiased methodology and our articles are not intended to be financial advice. It does not constitute a recommendation to buy or sell any stock, and does not take account of your objectives, or your financial situation. We aim to bring you long-term focused analysis driven by fundamental data. Note that our analysis may not factor in the latest price-sensitive company announcements or qualitative material. Simply Wall St has no position in any stocks mentioned.
