
 Yahoo Finance
 There's Been No Shortage Of Growth Recently For Deswell Industries' (NASDAQ:DSWL) Returns On Capital
To find a multi-bagger stock, what are the underlying trends we should look for in a business? One common approach is to try and find a company with returns on capital employed (ROCE) that are increasing, in conjunction with a growing amount of capital employed. Put simply, these types of businesses are compounding machines, meaning they are continually reinvesting their earnings at ever-higher rates of return. Speaking of which, we noticed some great changes in Deswell Industries' (NASDAQ:DSWL) returns on capital, so let's have a look.
Return On Capital Employed (ROCE): What Is It?
Just to clarify if you're unsure, ROCE is a metric for evaluating how much pre-tax income (in percentage terms) a company earns on the capital invested in its business. Analysts use this formula to calculate it for Deswell Industries:
Return on Capital Employed = Earnings Before Interest and Tax (EBIT) ÷ (Total Assets - Current Liabilities)
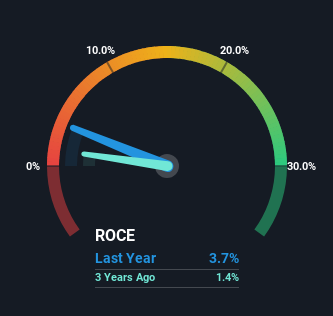
0.037 = US$3.4m ÷ (US$112m - US$20m) (Based on the trailing twelve months to September 2023).
Thus, Deswell Industries has an ROCE of 3.7%. Ultimately, that's a low return and it under-performs the Electronic industry average of 12%.
Check out our latest analysis for Deswell Industries
While the past is not representative of the future, it can be helpful to know how a company has performed historically, which is why we have this chart above. If you want to delve into the historical earnings, revenue and cash flow of Deswell Industries, check out these free graphs here.
What The Trend Of ROCE Can Tell Us
While the ROCE isn't as high as some other companies out there, it's great to see it's on the up. More specifically, while the company has kept capital employed relatively flat over the last five years, the ROCE has climbed 429% in that same time. So it's likely that the business is now reaping the full benefits of its past investments, since the capital employed hasn't changed considerably. It's worth looking deeper into this though because while it's great that the business is more efficient, it might also mean that going forward the areas to invest internally for the organic growth are lacking.
The Bottom Line
To bring it all together, Deswell Industries has done well to increase the returns it's generating from its capital employed. Considering the stock has delivered 2.4% to its stockholders over the last five years, it may be fair to think that investors aren't fully aware of the promising trends yet. Given that, we'd look further into this stock in case it has more traits that could make it multiply in the long term.
On a final note, we've found 2 warning signs for Deswell Industries that we think you should be aware of.
While Deswell Industries may not currently earn the highest returns, we've compiled a list of companies that currently earn more than 25% return on equity. Check out this free list here.
Have feedback on this article? Concerned about the content? Get in touch with us directly. Alternatively, email editorial-team (at) simplywallst.com.
This article by Simply Wall St is general in nature. We provide commentary based on historical data and analyst forecasts only using an unbiased methodology and our articles are not intended to be financial advice. It does not constitute a recommendation to buy or sell any stock, and does not take account of your objectives, or your financial situation. We aim to bring you long-term focused analysis driven by fundamental data. Note that our analysis may not factor in the latest price-sensitive company announcements or qualitative material. Simply Wall St has no position in any stocks mentioned.
