
 Yahoo Finance
 There's Been No Shortage Of Growth Recently For Isetan (Singapore)'s (SGX:I15) Returns On Capital
If you're not sure where to start when looking for the next multi-bagger, there are a few key trends you should keep an eye out for. One common approach is to try and find a company with returns on capital employed (ROCE) that are increasing, in conjunction with a growing amount of capital employed. Put simply, these types of businesses are compounding machines, meaning they are continually reinvesting their earnings at ever-higher rates of return. So on that note, Isetan (Singapore) (SGX:I15) looks quite promising in regards to its trends of return on capital.
Understanding Return On Capital Employed (ROCE)
For those that aren't sure what ROCE is, it measures the amount of pre-tax profits a company can generate from the capital employed in its business. The formula for this calculation on Isetan (Singapore) is:
Return on Capital Employed = Earnings Before Interest and Tax (EBIT) ÷ (Total Assets - Current Liabilities)
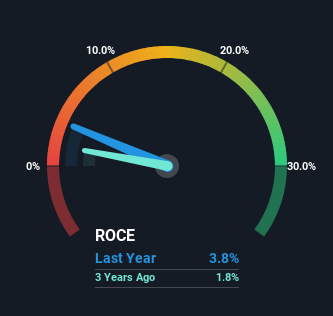
0.038 = S$5.1m ÷ (S$179m - S$44m) (Based on the trailing twelve months to June 2023).
Thus, Isetan (Singapore) has an ROCE of 3.8%. In absolute terms, that's a low return and it also under-performs the Multiline Retail industry average of 6.0%.
View our latest analysis for Isetan (Singapore)
While the past is not representative of the future, it can be helpful to know how a company has performed historically, which is why we have this chart above. If you'd like to look at how Isetan (Singapore) has performed in the past in other metrics, you can view this free graph of Isetan (Singapore)'s past earnings, revenue and cash flow.
What Can We Tell From Isetan (Singapore)'s ROCE Trend?
We're delighted to see that Isetan (Singapore) is reaping rewards from its investments and has now broken into profitability. While the business is profitable now, it used to be incurring losses on invested capital five years ago. At first glance, it seems the business is getting more proficient at generating returns, because over the same period, the amount of capital employed has reduced by 24%. Isetan (Singapore) could be selling under-performing assets since the ROCE is improving.
The Bottom Line
In summary, it's great to see that Isetan (Singapore) has been able to turn things around and earn higher returns on lower amounts of capital. Since the total return from the stock has been almost flat over the last five years, there might be an opportunity here if the valuation looks good. So researching this company further and determining whether or not these trends will continue seems justified.
Isetan (Singapore) does come with some risks though, we found 5 warning signs in our investment analysis, and 1 of those is significant...
If you want to search for solid companies with great earnings, check out this free list of companies with good balance sheets and impressive returns on equity.
Have feedback on this article? Concerned about the content? Get in touch with us directly. Alternatively, email editorial-team (at) simplywallst.com.
This article by Simply Wall St is general in nature. We provide commentary based on historical data and analyst forecasts only using an unbiased methodology and our articles are not intended to be financial advice. It does not constitute a recommendation to buy or sell any stock, and does not take account of your objectives, or your financial situation. We aim to bring you long-term focused analysis driven by fundamental data. Note that our analysis may not factor in the latest price-sensitive company announcements or qualitative material. Simply Wall St has no position in any stocks mentioned.
