
 Yahoo Finance
 There's Been No Shortage Of Growth Recently For HL Global Enterprises' (SGX:AVX) Returns On Capital
Finding a business that has the potential to grow substantially is not easy, but it is possible if we look at a few key financial metrics. Ideally, a business will show two trends; firstly a growing return on capital employed (ROCE) and secondly, an increasing amount of capital employed. This shows us that it's a compounding machine, able to continually reinvest its earnings back into the business and generate higher returns. So when we looked at HL Global Enterprises (SGX:AVX) and its trend of ROCE, we really liked what we saw.
Understanding Return On Capital Employed (ROCE)
For those that aren't sure what ROCE is, it measures the amount of pre-tax profits a company can generate from the capital employed in its business. To calculate this metric for HL Global Enterprises, this is the formula:
Return on Capital Employed = Earnings Before Interest and Tax (EBIT) ÷ (Total Assets - Current Liabilities)
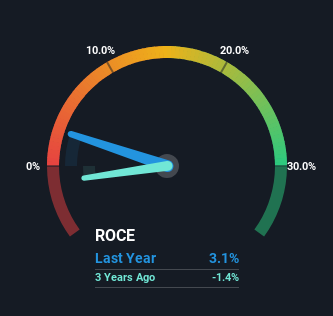
0.031 = S$2.4m ÷ (S$79m - S$2.2m) (Based on the trailing twelve months to December 2023).
Therefore, HL Global Enterprises has an ROCE of 3.1%. In absolute terms, that's a low return and it also under-performs the Hospitality industry average of 3.9%.
View our latest analysis for HL Global Enterprises
While the past is not representative of the future, it can be helpful to know how a company has performed historically, which is why we have this chart above. If you'd like to look at how HL Global Enterprises has performed in the past in other metrics, you can view this free graph of HL Global Enterprises' past earnings, revenue and cash flow.
What The Trend Of ROCE Can Tell Us
HL Global Enterprises has broken into the black (profitability) and we're sure it's a sight for sore eyes. While the business was unprofitable in the past, it's now turned things around and is earning 3.1% on its capital. On top of that, what's interesting is that the amount of capital being employed has remained steady, so the business hasn't needed to put any additional money to work to generate these higher returns. That being said, while an increase in efficiency is no doubt appealing, it'd be helpful to know if the company does have any investment plans going forward. Because in the end, a business can only get so efficient.
The Bottom Line
As discussed above, HL Global Enterprises appears to be getting more proficient at generating returns since capital employed has remained flat but earnings (before interest and tax) are up. Given the stock has declined 41% in the last five years, this could be a good investment if the valuation and other metrics are also appealing. With that in mind, we believe the promising trends warrant this stock for further investigation.
If you'd like to know more about HL Global Enterprises, we've spotted 3 warning signs, and 1 of them is potentially serious.
While HL Global Enterprises isn't earning the highest return, check out this free list of companies that are earning high returns on equity with solid balance sheets.
Have feedback on this article? Concerned about the content? Get in touch with us directly. Alternatively, email editorial-team (at) simplywallst.com.
This article by Simply Wall St is general in nature. We provide commentary based on historical data and analyst forecasts only using an unbiased methodology and our articles are not intended to be financial advice. It does not constitute a recommendation to buy or sell any stock, and does not take account of your objectives, or your financial situation. We aim to bring you long-term focused analysis driven by fundamental data. Note that our analysis may not factor in the latest price-sensitive company announcements or qualitative material. Simply Wall St has no position in any stocks mentioned.
