
 Yahoo Finance
 There's Been No Shortage Of Growth Recently For CosmoSteel Holdings' (SGX:B9S) Returns On Capital
If we want to find a potential multi-bagger, often there are underlying trends that can provide clues. One common approach is to try and find a company with returns on capital employed (ROCE) that are increasing, in conjunction with a growing amount of capital employed. If you see this, it typically means it's a company with a great business model and plenty of profitable reinvestment opportunities. Speaking of which, we noticed some great changes in CosmoSteel Holdings' (SGX:B9S) returns on capital, so let's have a look.
Return On Capital Employed (ROCE): What Is It?
Just to clarify if you're unsure, ROCE is a metric for evaluating how much pre-tax income (in percentage terms) a company earns on the capital invested in its business. The formula for this calculation on CosmoSteel Holdings is:
Return on Capital Employed = Earnings Before Interest and Tax (EBIT) ÷ (Total Assets - Current Liabilities)
0.055 = S$4.8m ÷ (S$102m - S$14m) (Based on the trailing twelve months to September 2023).
Therefore, CosmoSteel Holdings has an ROCE of 5.5%. On its own, that's a low figure but it's around the 5.7% average generated by the Energy Services industry.
View our latest analysis for CosmoSteel Holdings
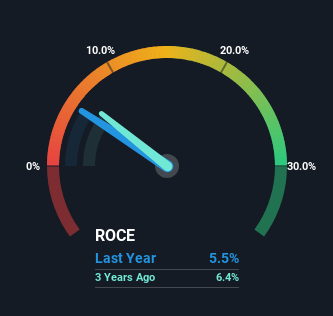
Historical performance is a great place to start when researching a stock so above you can see the gauge for CosmoSteel Holdings' ROCE against it's prior returns. If you want to delve into the historical earnings , check out these free graphs detailing revenue and cash flow performance of CosmoSteel Holdings.
How Are Returns Trending?
CosmoSteel Holdings has broken into the black (profitability) and we're sure it's a sight for sore eyes. The company now earns 5.5% on its capital, because five years ago it was incurring losses. While returns have increased, the amount of capital employed by CosmoSteel Holdings has remained flat over the period. That being said, while an increase in efficiency is no doubt appealing, it'd be helpful to know if the company does have any investment plans going forward. Because in the end, a business can only get so efficient.
On a related note, the company's ratio of current liabilities to total assets has decreased to 14%, which basically reduces it's funding from the likes of short-term creditors or suppliers. So shareholders would be pleased that the growth in returns has mostly come from underlying business performance.
What We Can Learn From CosmoSteel Holdings' ROCE
To sum it up, CosmoSteel Holdings is collecting higher returns from the same amount of capital, and that's impressive. And a remarkable 217% total return over the last five years tells us that investors are expecting more good things to come in the future. With that being said, we still think the promising fundamentals mean the company deserves some further due diligence.
On a final note, we've found 3 warning signs for CosmoSteel Holdings that we think you should be aware of.
For those who like to invest in solid companies, check out this free list of companies with solid balance sheets and high returns on equity.
Have feedback on this article? Concerned about the content? Get in touch with us directly. Alternatively, email editorial-team (at) simplywallst.com.
This article by Simply Wall St is general in nature. We provide commentary based on historical data and analyst forecasts only using an unbiased methodology and our articles are not intended to be financial advice. It does not constitute a recommendation to buy or sell any stock, and does not take account of your objectives, or your financial situation. We aim to bring you long-term focused analysis driven by fundamental data. Note that our analysis may not factor in the latest price-sensitive company announcements or qualitative material. Simply Wall St has no position in any stocks mentioned.
