
 Yahoo Finance
 Telefonica Brasil SA's Dividend Analysis
An In-depth Look at Telefonica Brasil SA's Upcoming Dividend and Historical Performance
Telefonica Brasil SA (NYSE:VIV) recently announced a dividend of $0.18 per share, payable on a to-be-announced date, with the ex-dividend date set for 2024-04-09. As investors look forward to this upcoming payment, the spotlight also shines on the company's dividend history, yield, and growth rates. Using the data from GuruFocus, let's look into Telefonica Brasil SA's dividend performance and assess its sustainability.
Company Overview
This Powerful Chart Made Peter Lynch 29% A Year For 13 Years
How to calculate the intrinsic value of a stock?
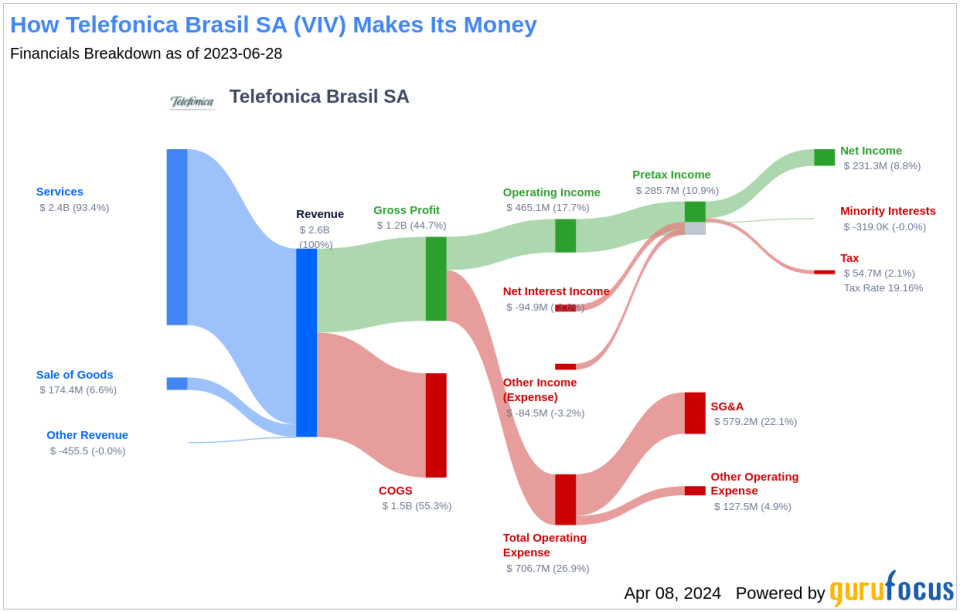
Telefonica Brasil, known as Vivo, is the largest wireless carrier in Brazil with 99 million customers, which is equal to about 40% market share. The firm is strongest in the postpaid business, where it has 62 million customers, or about 42% share of this market. Wireless services and equipment contribute about 70% of total revenue. Vivo is the incumbent fixed-line telephone operator in Sao Paulo state and, following the acquisition of GVT, the owner of an extensive fiber network across the country. The firm provides internet access to 6.6 million households on this network. The firm also sells pay-tv and phone services to its fixed-line customers. Finally, corporate data and IT services, including cloud computing support, contribute about 8% of total revenue.
Telefonica Brasil SA's Dividend Track Record
Telefonica Brasil SA has maintained a consistent dividend payment record since 2000. Dividends are currently distributed on a monthly basis. Below is a chart showing annual Dividends Per Share for tracking historical trends.
Understanding Dividend Yield and Growth
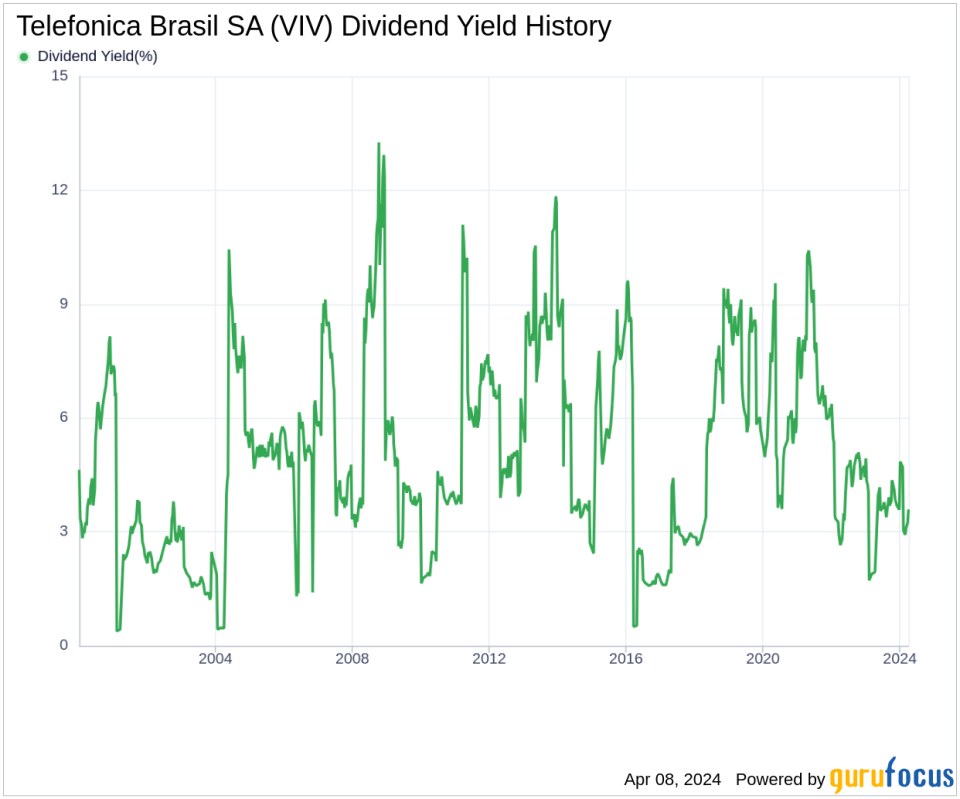
As of today, Telefonica Brasil SA currently has a 12-month trailing dividend yield of 3.59% and a 12-month forward dividend yield of 5.38%. This suggests an expectation of increased dividend payments over the next 12 months. Over the past three years, Telefonica Brasil SA's annual dividend growth rate was -5.90%. Extended to a five-year horizon, this rate decreased to -12.00% per year. And over the past decade, Telefonica Brasil SA's annual dividends per share growth rate stands at -3.40%.
Based on Telefonica Brasil SA's dividend yield and five-year growth rate, the 5-year yield on cost of Telefonica Brasil SA stock as of today is approximately 1.89%.
Assessing Dividend Sustainability
To assess the sustainability of the dividend, one needs to evaluate the company's payout ratio. The dividend payout ratio provides insights into the portion of earnings the company distributes as dividends. A lower ratio suggests that the company retains a significant part of its earnings, thereby ensuring the availability of funds for future growth and unexpected downturns. As of 2023-12-31, Telefonica Brasil SA's dividend payout ratio is 0.36.
Telefonica Brasil SA's profitability rank, offers an understanding of the company's earnings prowess relative to its peers. GuruFocus ranks Telefonica Brasil SA's profitability 7 out of 10 as of 2023-12-31, suggesting good profitability prospects. The company has reported positive net income for each of year over the past decade, further solidifying its high profitability.
Prospective Growth and Revenue Trends
To ensure the sustainability of dividends, a company must have robust growth metrics. Telefonica Brasil SA's growth rank of 7 out of 10 suggests that the company's growth trajectory is good relative to its competitors.
Revenue is the lifeblood of any company, and Telefonica Brasil SA's revenue per share, combined with the 3-year revenue growth rate, indicates a strong revenue model. Telefonica Brasil SA's revenue has increased by approximately 7.10% per year on average, a rate that outperforms approximately 62.94% of global competitors.
The company's 3-year EPS growth rate showcases its capability to grow its earnings, a critical component for sustaining dividends in the long run. During the past three years, Telefonica Brasil SA's earnings increased by approximately 10.80% per year on average, a rate that outperforms approximately 57.42% of global competitors.
Lastly, the company's 5-year EBITDA growth rate of 0.30%, which outperforms approximately 31.28% of global competitors.
Conclusive Insights on Telefonica Brasil SA's Dividends
In conclusion, Telefonica Brasil SA's upcoming dividend, consistent historical payments, and a reasonable payout ratio indicate a commitment to returning value to shareholders. Despite a decline in the dividend growth rate over the past years, the company's strong profitability and growth metrics provide a positive outlook for future dividend sustainability. Value investors might consider Telefonica Brasil SA's dividend profile as part of a diversified investment strategy, keeping in mind the company's market position and financial health. Will Telefonica Brasil SA continue its trend of rewarding investors, and how will future market conditions affect its dividend strategy? These are critical questions for investors to ponder as they assess the company's long-term potential.
GuruFocus Premium users can screen for high-dividend yield stocks using the High Dividend Yield Screener.
This article, generated by GuruFocus, is designed to provide general insights and is not tailored financial advice. Our commentary is rooted in historical data and analyst projections, utilizing an impartial methodology, and is not intended to serve as specific investment guidance. It does not formulate a recommendation to purchase or divest any stock and does not consider individual investment objectives or financial circumstances. Our objective is to deliver long-term, fundamental data-driven analysis. Be aware that our analysis might not incorporate the most recent, price-sensitive company announcements or qualitative information. GuruFocus holds no position in the stocks mentioned herein.
This article first appeared on GuruFocus.
