
 Yahoo Finance
 TEHO International Inc Ltd. (Catalist:5OQ) Screens Well But There Might Be A Catch
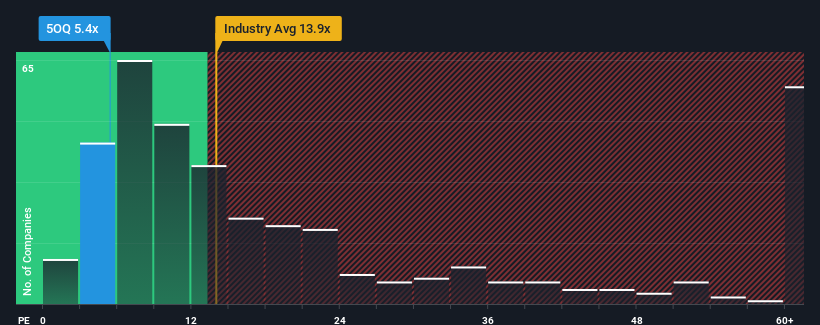
TEHO International Inc Ltd.'s (Catalist:5OQ) price-to-earnings (or "P/E") ratio of 5.4x might make it look like a strong buy right now compared to the market in Singapore, where around half of the companies have P/E ratios above 13x and even P/E's above 23x are quite common. Although, it's not wise to just take the P/E at face value as there may be an explanation why it's so limited.
For example, consider that TEHO International's financial performance has been pretty ordinary lately as earnings growth is non-existent. One possibility is that the P/E is low because investors think this benign earnings growth rate will likely underperform the broader market in the near future. If not, then existing shareholders may be feeling optimistic about the future direction of the share price.
See our latest analysis for TEHO International
Want the full picture on earnings, revenue and cash flow for the company? Then our free report on TEHO International will help you shine a light on its historical performance.
Is There Any Growth For TEHO International?
There's an inherent assumption that a company should far underperform the market for P/E ratios like TEHO International's to be considered reasonable.
Retrospectively, the last year delivered virtually the same number to the company's bottom line as the year before. Although pleasingly EPS has lifted 139% in aggregate from three years ago, notwithstanding the last 12 months. Therefore, it's fair to say the earnings growth recently has been superb for the company.
This is in contrast to the rest of the market, which is expected to grow by 9.2% over the next year, materially lower than the company's recent medium-term annualised growth rates.
With this information, we find it odd that TEHO International is trading at a P/E lower than the market. Apparently some shareholders believe the recent performance has exceeded its limits and have been accepting significantly lower selling prices.
The Final Word
Using the price-to-earnings ratio alone to determine if you should sell your stock isn't sensible, however it can be a practical guide to the company's future prospects.
Our examination of TEHO International revealed its three-year earnings trends aren't contributing to its P/E anywhere near as much as we would have predicted, given they look better than current market expectations. When we see strong earnings with faster-than-market growth, we assume potential risks are what might be placing significant pressure on the P/E ratio. It appears many are indeed anticipating earnings instability, because the persistence of these recent medium-term conditions would normally provide a boost to the share price.
And what about other risks? Every company has them, and we've spotted 3 warning signs for TEHO International (of which 1 is significant!) you should know about.
Of course, you might find a fantastic investment by looking at a few good candidates. So take a peek at this free list of companies with a strong growth track record, trading on a low P/E.
Have feedback on this article? Concerned about the content? Get in touch with us directly. Alternatively, email editorial-team (at) simplywallst.com.
This article by Simply Wall St is general in nature. We provide commentary based on historical data and analyst forecasts only using an unbiased methodology and our articles are not intended to be financial advice. It does not constitute a recommendation to buy or sell any stock, and does not take account of your objectives, or your financial situation. We aim to bring you long-term focused analysis driven by fundamental data. Note that our analysis may not factor in the latest price-sensitive company announcements or qualitative material. Simply Wall St has no position in any stocks mentioned.
