
 Yahoo Finance
 Technical Weekly: USD/JPY Still Making History
DailyFX.com -
EUR/USD - dangerous situation
USD/JPY - nearly 12% in 5 weeks
USD/CAD bearish wedge gaining traction
--Subscribe to Jamie Saettele's distribution list in order to receive a free report to your inbox several times a week.
--Quarterly charts and comments
EUR/USD
Weekly
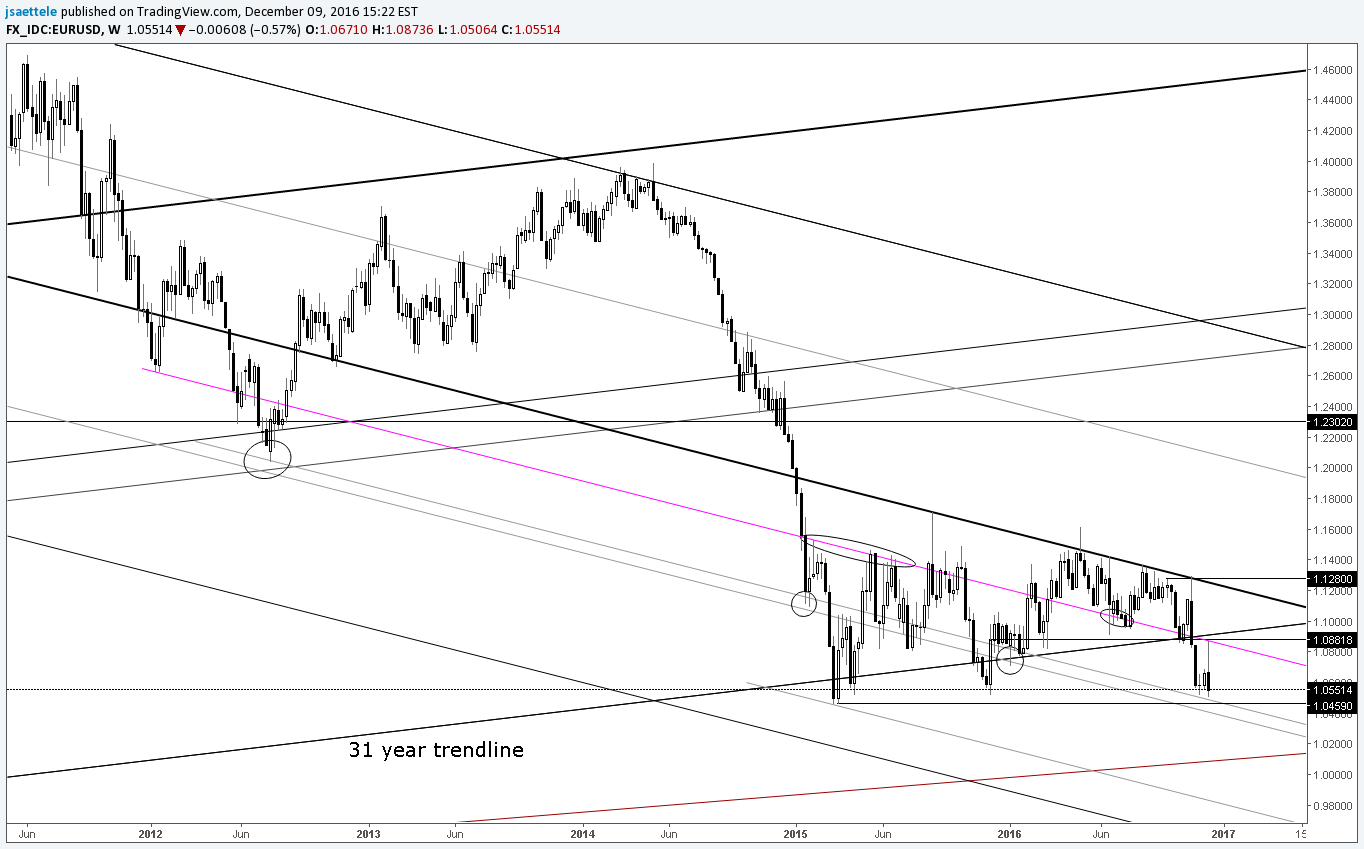
Chart Prepared by Jamie Saettele, CMT
See REAL TIME trader positioning
High Frequency Trading Tools
-FXTW wrote last week that “the combination of EUR/USD at range lows (same place as last year in fact…EUR/USD closed at 1.0614 on 12/2/2015), the doji, and sentiment provides a powerful bullish backdrop.” EUR/USD took out the lows, rallied nearly 400 pips (a quarter of that in the seconds after ECB), and reversed almost everything in a few hours. In other words, EUR/USD is left unchanged from where it was in late November. The rejection of the rally post-ECB at the year open, which also filled the mid-November gap, is not bullish. Even so, EUR/USD has yet to break range lows despite DXY trading at nearly 14 year highs. The non-confirmation is a warning. Bottom line, this market is in a dangerous position for either side. I’m wondering if this ends with a 1 day crash and reversal. Check out this video for more.
As always, define your risk points (read more about traits of successful traders here).
-For forecasts and 2016 opportunities, check out the DailyFX Trading Guides.
GBP/USD
Weekly
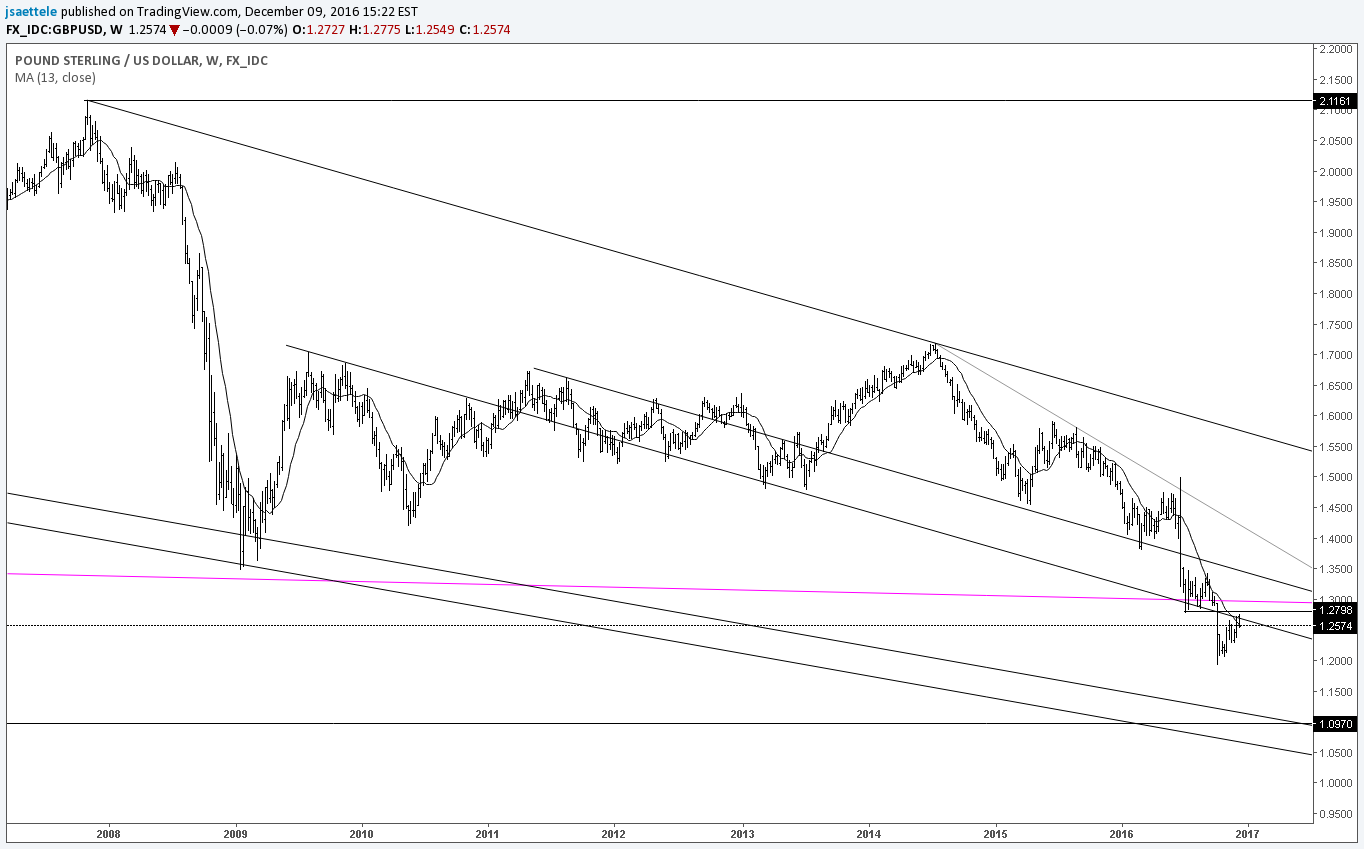
Chart Prepared by Jamie Saettele, CMT
See REAL TIME trader positioning
-There is no change to the GBP/USD weekly analysis. “The GBP/USD rally contends with its first major resistance point since the October crash. The levels in question are the July low at 1.2791, August low at 1.2865 and a long term parallel that has cut through some big inflection points over the last 7 years. The 96 month (8 year) cycle low count is still in the back of my mind as well.”
AUD/USD
Weekly

Chart Prepared by Jamie Saettele, CMT
See REAL TIME trader positioning
-There is no change to recent comments as AUD/USD has followed through on the bearish outside week. “AUD/USD traded to its highest since the week of the April high and closed at its lowest week since mid-October. The bearish outside week is…bearish, until further notice. As noted a number of times in recent weeks, a weekly close above .7719 is needed in order to signal a major upside breakout. The action suggests that Aussie is vulnerable.”
NZD/USD
Weekly

Chart Prepared by Jamie Saettele, CMT
See REAL TIME trader positioning
-NZD/USD is still testing the underside of former trendline support. “After reversing from the ‘magnetic’ 1985-1993 trendline, Kiwi carved a bearish outside week which suggested that the interpretation of price action since July as a top, rather than consolidation, would win out. The break under trendline support this week reinforces the idea that NZD/USD is headed lower. In fact, the entire rally from August 2015 may be just a re-test of the long term bear move that began with the double top confirmation in early 2015.”
USD/JPY
Weekly
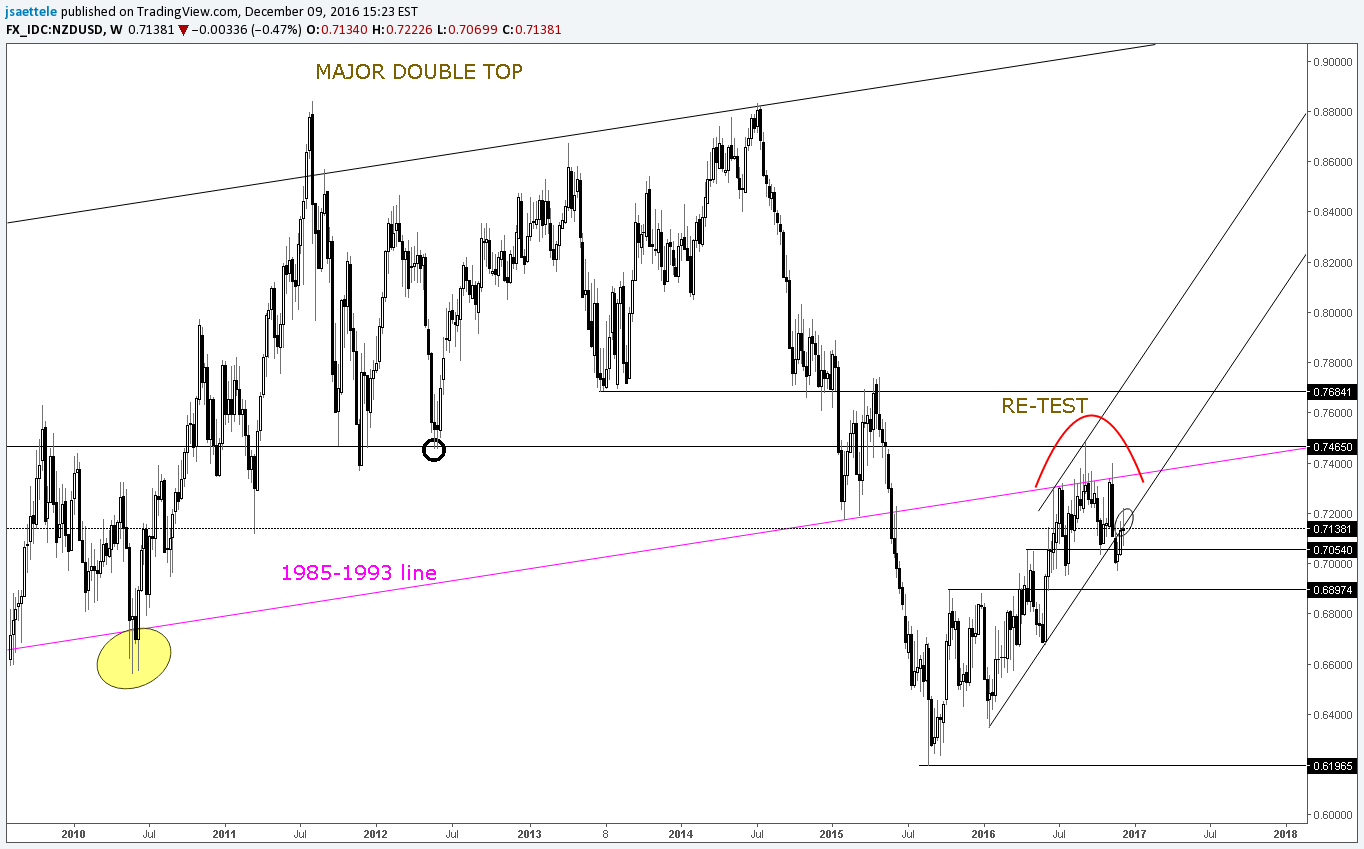
Chart Prepared by Jamie Saettele, CMT
See REAL TIME trader positioning
-The 5 week performance (11.8%) in USD/JPY is bested by only the 5 weeks that ended the first week of December 1978 (the rate fell sharply the next 3 weeks). USD/JPY downside is typically associated with sharper moves so it’s interesting to note that the rate has realized 5 week declines of at least 11.8% just 3 times, October 2008 (peak of GFC), October 1998 (LTCM), and October 1985 (after Plaza Accord). 1985 is the only instance that failed to realize a sharp countertrend move. In summary, the extreme rate of change as USD/JPY pressing into the late 2014-early 2016 floor indicates a high risk situation.
USD/CAD
Weekly

Chart Prepared by Jamie Saettele, CMT
See REAL TIME trader positioning
-The bearish wedge from the May low possibility remains on the table. Weekly RSI turning over at 60 is typical of sideways or downward trends. Also, notice that the rate has turned down from the same price region that price accelerated higher from exactly one year ago. The observation suggests a good deal of vested interest in the price region and therefore potential for an important change to take place.”
USD/CHF
Weekly

Chart Prepared by Jamie Saettele, CMT
See REAL TIME trader positioning
-Don’t forget about the long term time symmetry described here. The rectangle breakout has materialized. Given probes of a VERY long term parallel beginning in November 2015, this rectangle could end up launching a major behavior change and rally to 1.15 or so (trendline from 1985). This interpretation is favored as long as price is above this week’s (outside week) low.
DailyFX provides forex news and technical analysis on the trends that influence the global currency markets.
Learn forex trading with a free practice account and trading charts from IG.