
 Yahoo Finance
 Is Tecan Group AG's (VTX:TECN) Latest Stock Performance A Reflection Of Its Financial Health?
Tecan Group (VTX:TECN) has had a great run on the share market with its stock up by a significant 12% over the last three months. Since the market usually pay for a company’s long-term fundamentals, we decided to study the company’s key performance indicators to see if they could be influencing the market. Specifically, we decided to study Tecan Group's ROE in this article.
Return on Equity or ROE is a test of how effectively a company is growing its value and managing investors’ money. In other words, it is a profitability ratio which measures the rate of return on the capital provided by the company's shareholders.
View our latest analysis for Tecan Group
How Do You Calculate Return On Equity?
The formula for ROE is:
Return on Equity = Net Profit (from continuing operations) ÷ Shareholders' Equity
So, based on the above formula, the ROE for Tecan Group is:
9.8% = CHF132m ÷ CHF1.3b (Based on the trailing twelve months to December 2023).
The 'return' is the income the business earned over the last year. That means that for every CHF1 worth of shareholders' equity, the company generated CHF0.10 in profit.
What Is The Relationship Between ROE And Earnings Growth?
Thus far, we have learned that ROE measures how efficiently a company is generating its profits. Depending on how much of these profits the company reinvests or "retains", and how effectively it does so, we are then able to assess a company’s earnings growth potential. Assuming everything else remains unchanged, the higher the ROE and profit retention, the higher the growth rate of a company compared to companies that don't necessarily bear these characteristics.
Tecan Group's Earnings Growth And 9.8% ROE
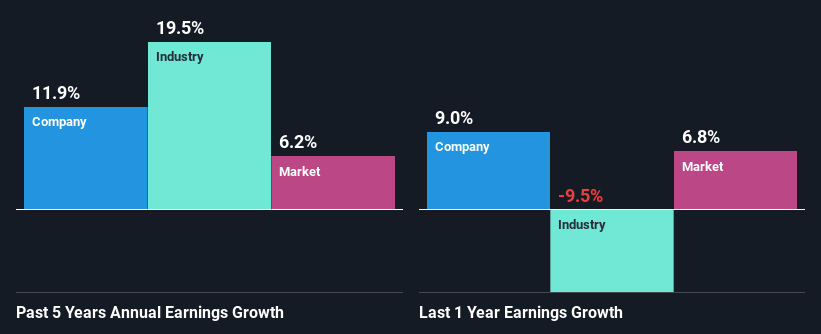
At first glance, Tecan Group seems to have a decent ROE. And on comparing with the industry, we found that the the average industry ROE is similar at 9.1%. This probably goes some way in explaining Tecan Group's moderate 12% growth over the past five years amongst other factors.
As a next step, we compared Tecan Group's net income growth with the industry and were disappointed to see that the company's growth is lower than the industry average growth of 19% in the same period.
Earnings growth is an important metric to consider when valuing a stock. It’s important for an investor to know whether the market has priced in the company's expected earnings growth (or decline). Doing so will help them establish if the stock's future looks promising or ominous. Is TECN fairly valued? This infographic on the company's intrinsic value has everything you need to know.
Is Tecan Group Using Its Retained Earnings Effectively?
With a three-year median payout ratio of 30% (implying that the company retains 70% of its profits), it seems that Tecan Group is reinvesting efficiently in a way that it sees respectable amount growth in its earnings and pays a dividend that's well covered.
Besides, Tecan Group has been paying dividends for at least ten years or more. This shows that the company is committed to sharing profits with its shareholders. Our latest analyst data shows that the future payout ratio of the company over the next three years is expected to be approximately 26%. Accordingly, forecasts suggest that Tecan Group's future ROE will be 10% which is again, similar to the current ROE.
Conclusion
On the whole, we feel that Tecan Group's performance has been quite good. In particular, it's great to see that the company is investing heavily into its business and along with a high rate of return, that has resulted in a respectable growth in its earnings. The latest industry analyst forecasts show that the company is expected to maintain its current growth rate. Are these analysts expectations based on the broad expectations for the industry, or on the company's fundamentals? Click here to be taken to our analyst's forecasts page for the company.
Have feedback on this article? Concerned about the content? Get in touch with us directly. Alternatively, email editorial-team (at) simplywallst.com.
This article by Simply Wall St is general in nature. We provide commentary based on historical data and analyst forecasts only using an unbiased methodology and our articles are not intended to be financial advice. It does not constitute a recommendation to buy or sell any stock, and does not take account of your objectives, or your financial situation. We aim to bring you long-term focused analysis driven by fundamental data. Note that our analysis may not factor in the latest price-sensitive company announcements or qualitative material. Simply Wall St has no position in any stocks mentioned.
