
 Yahoo Finance
 Tai Sin Electric's (SGX:500) Returns Have Hit A Wall
If we want to find a potential multi-bagger, often there are underlying trends that can provide clues. Typically, we'll want to notice a trend of growing return on capital employed (ROCE) and alongside that, an expanding base of capital employed. Ultimately, this demonstrates that it's a business that is reinvesting profits at increasing rates of return. However, after investigating Tai Sin Electric (SGX:500), we don't think it's current trends fit the mold of a multi-bagger.
Understanding Return On Capital Employed (ROCE)
Just to clarify if you're unsure, ROCE is a metric for evaluating how much pre-tax income (in percentage terms) a company earns on the capital invested in its business. Analysts use this formula to calculate it for Tai Sin Electric:
Return on Capital Employed = Earnings Before Interest and Tax (EBIT) ÷ (Total Assets - Current Liabilities)
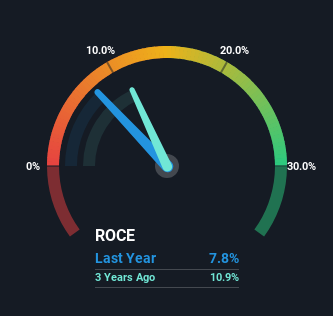
0.078 = S$17m ÷ (S$304m - S$88m) (Based on the trailing twelve months to December 2023).
Therefore, Tai Sin Electric has an ROCE of 7.8%. Even though it's in line with the industry average of 8.2%, it's still a low return by itself.
See our latest analysis for Tai Sin Electric
While the past is not representative of the future, it can be helpful to know how a company has performed historically, which is why we have this chart above. If you'd like to look at how Tai Sin Electric has performed in the past in other metrics, you can view this free graph of Tai Sin Electric's past earnings, revenue and cash flow.
What Can We Tell From Tai Sin Electric's ROCE Trend?
The returns on capital haven't changed much for Tai Sin Electric in recent years. The company has consistently earned 7.8% for the last five years, and the capital employed within the business has risen 24% in that time. This poor ROCE doesn't inspire confidence right now, and with the increase in capital employed, it's evident that the business isn't deploying the funds into high return investments.
The Bottom Line On Tai Sin Electric's ROCE
In conclusion, Tai Sin Electric has been investing more capital into the business, but returns on that capital haven't increased. Although the market must be expecting these trends to improve because the stock has gained 62% over the last five years. However, unless these underlying trends turn more positive, we wouldn't get our hopes up too high.
One more thing to note, we've identified 2 warning signs with Tai Sin Electric and understanding these should be part of your investment process.
If you want to search for solid companies with great earnings, check out this free list of companies with good balance sheets and impressive returns on equity.
Have feedback on this article? Concerned about the content? Get in touch with us directly. Alternatively, email editorial-team (at) simplywallst.com.
This article by Simply Wall St is general in nature. We provide commentary based on historical data and analyst forecasts only using an unbiased methodology and our articles are not intended to be financial advice. It does not constitute a recommendation to buy or sell any stock, and does not take account of your objectives, or your financial situation. We aim to bring you long-term focused analysis driven by fundamental data. Note that our analysis may not factor in the latest price-sensitive company announcements or qualitative material. Simply Wall St has no position in any stocks mentioned.
