
 Yahoo Finance
 T. Rowe Price (TROW) to Post Q1 Earnings: What to Expect?
T. Rowe Price Group, Inc. TROW is scheduled to report first-quarter 2024 results on Apr 26, before the opening bell. TROW’s quarterly revenues and earnings are expected to have witnessed improvements from the year-ago reported levels.
In the last reported quarter, the company’s earnings surpassed the Zacks Consensus Estimate. Its net revenues were supported by a rise in assets under management (AUM). Also, a decline in expenses aided bottom-line growth to some extent.
T. Rowe Price’s earnings outpaced the Zacks Consensus Estimate in the trailing four quarters, the average surprise being 11.73%.
T. Rowe Price Group, Inc. Price and EPS Surprise
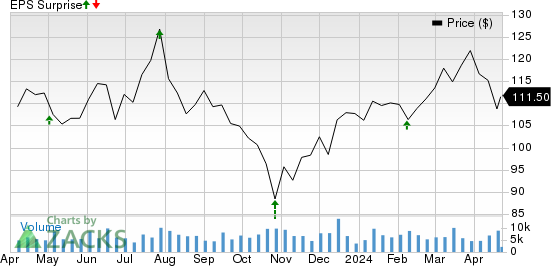
T. Rowe Price Group, Inc. price-eps-surprise | T. Rowe Price Group, Inc. Quote
TROW’s activities in the quarter under review were adequate to gain analysts’ confidence. As a result, the Zacks Consensus Estimate for first-quarter earnings of $2.01 per share has moved 2.5% north over the past month. However, the figure indicates a year-over-year decline of 18.9%.
The consensus estimate for revenues of $1.71 billion implies 11.2% growth from the prior-year quarter’s actual.
Key Factors & Estimates for Q1
Last year’s stock market rally continued in the January-March quarter, with the S&P 500 Index rising 10.2%, indicating a favorable equity-market performance. However, fixed-income markets could not catch up with the equity markets. The Bloomberg U.S. Aggregate Bond Index declined during the quarter. Hence, the March-end quarter’s performances of asset managers are expected to have been positively impacted by solid equity market returns, partially offset by weak fixed income markets.
However, secular trends like market share tilt from active to passive, open-ended mutual funds to exchange traded funds, collective investment trusts and SMAs, and public markets to private markets are expected to have affected TROW’s quarterly performance.
Amid the challenging operating environment, T. Rowe Price is likely to have continued to record net outflows in the first quarter. Per the company’s monthly metrics data, its net outflows were $8 billion in the quarter under review.
Despite this, the company’s preliminary AUM of $1.54 trillion as of Mar 31, 2024, increased 6.7% from Dec 31, 2023. Although the preliminary AUM balance shows a sequential rise, TROW’s investment management business is likely to have been negatively impacted by market fluctuations and foreign exchange translations. The Zacks Consensus Estimate for investment advisory fee is pegged at $1.49 billion, indicating a rise of 2.2% on a sequential basis. Our estimate for the same is pegged at $1.45 billion.
The consensus estimate for administrative, distribution and servicing fees of $150 million indicates a 6.4% increase from the prior quarter’s actual. Our estimate for the metric is pegged at $161 million.
Coming to expenses, T. Rowe Price invests substantially to upgrade technology to align with changing customer needs. The company’s initiatives to attract investment advisory clients and additional investments from its existing clients are expected to have led to significant expenditure. Thus, overall expenses are expected to have risen in the quarter under review, impeding bottom-line growth.
Our estimate for operating expenses (GAAP basis) is pegged at $1.2 billion, indicating a 14.3% year-over-year increase.
What the Zacks Model Unveils
According to our proven model, the chances of T. Rowe Price beating the Zacks Consensus Estimate for earnings this time are low. This is because the company does not have the right combination of the two key elements, a positive Earnings ESP and Zacks Rank #1 (Strong Buy), 2 (Buy) or 3 (Hold).
You can uncover the best stocks to buy or sell before they are reported with our Earnings ESP Filter.
Earnings ESP: TROW has an Earnings ESP of 0.00%.
Zacks Rank: T. Rowe Price currently sports a Zacks Rank of 1. You can see the complete list of today’s Zacks #1 Rank stocks here.
Finance Stocks Worth a Look
Here are a couple of finance stocks that you may want to consider, as our model shows that these have the right combination of elements to post an earnings beat this time:
The Earnings ESP for Mr. Cooper Group COOP is +1.90% and it carries a Zacks Rank #3 at present. The company is slated to report first-quarter 2024 results on Apr 24.
Over the past 30 days, the Zacks Consensus Estimate for COOP’s quarterly earnings has moved 2.9% north to $2.11 per share.
SEI Investments SEIC is scheduled to release quarterly numbers on Apr 24. The company, which carries a Zacks Rank #2 at present, has an Earnings ESP of +2.50%.
SEIC’s quarterly earnings estimates have been revised 1% upward to 97 cents over the past month.
Stay on top of upcoming earnings announcements with the Zacks Earnings Calendar.
Want the latest recommendations from Zacks Investment Research? Today, you can download 7 Best Stocks for the Next 30 Days. Click to get this free report
T. Rowe Price Group, Inc. (TROW) : Free Stock Analysis Report
SEI Investments Company (SEIC) : Free Stock Analysis Report
MR. COOPER GROUP INC (COOP) : Free Stock Analysis Report
