
 Yahoo Finance
 Sunpower Group (SGX:5GD) Hasn't Managed To Accelerate Its Returns
If we want to find a stock that could multiply over the long term, what are the underlying trends we should look for? Typically, we'll want to notice a trend of growing return on capital employed (ROCE) and alongside that, an expanding base of capital employed. Ultimately, this demonstrates that it's a business that is reinvesting profits at increasing rates of return. So, when we ran our eye over Sunpower Group's (SGX:5GD) trend of ROCE, we liked what we saw.
Understanding Return On Capital Employed (ROCE)
For those who don't know, ROCE is a measure of a company's yearly pre-tax profit (its return), relative to the capital employed in the business. To calculate this metric for Sunpower Group, this is the formula:
Return on Capital Employed = Earnings Before Interest and Tax (EBIT) ÷ (Total Assets - Current Liabilities)
0.11 = CN¥628m ÷ (CN¥7.6b - CN¥1.9b) (Based on the trailing twelve months to December 2023).
So, Sunpower Group has an ROCE of 11%. On its own, that's a standard return, however it's much better than the 6.9% generated by the Machinery industry.
View our latest analysis for Sunpower Group
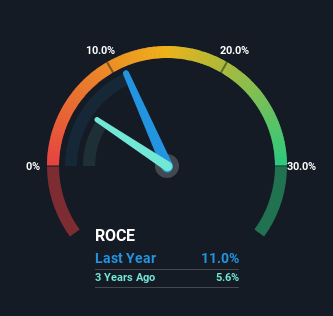
Historical performance is a great place to start when researching a stock so above you can see the gauge for Sunpower Group's ROCE against it's prior returns. If you're interested in investigating Sunpower Group's past further, check out this free graph covering Sunpower Group's past earnings, revenue and cash flow.
What Does the ROCE Trend For Sunpower Group Tell Us?
While the current returns on capital are decent, they haven't changed much. Over the past five years, ROCE has remained relatively flat at around 11% and the business has deployed 61% more capital into its operations. 11% is a pretty standard return, and it provides some comfort knowing that Sunpower Group has consistently earned this amount. Over long periods of time, returns like these might not be too exciting, but with consistency they can pay off in terms of share price returns.
One more thing to note, even though ROCE has remained relatively flat over the last five years, the reduction in current liabilities to 25% of total assets, is good to see from a business owner's perspective. This can eliminate some of the risks inherent in the operations because the business has less outstanding obligations to their suppliers and or short-term creditors than they did previously.
Our Take On Sunpower Group's ROCE
To sum it up, Sunpower Group has simply been reinvesting capital steadily, at those decent rates of return. However, despite the favorable fundamentals, the stock has fallen 44% over the last five years, so there might be an opportunity here for astute investors. That's why we think it'd be worthwhile to look further into this stock given the fundamentals are appealing.
Sunpower Group does have some risks though, and we've spotted 1 warning sign for Sunpower Group that you might be interested in.
For those who like to invest in solid companies, check out this free list of companies with solid balance sheets and high returns on equity.
Have feedback on this article? Concerned about the content? Get in touch with us directly. Alternatively, email editorial-team (at) simplywallst.com.
This article by Simply Wall St is general in nature. We provide commentary based on historical data and analyst forecasts only using an unbiased methodology and our articles are not intended to be financial advice. It does not constitute a recommendation to buy or sell any stock, and does not take account of your objectives, or your financial situation. We aim to bring you long-term focused analysis driven by fundamental data. Note that our analysis may not factor in the latest price-sensitive company announcements or qualitative material. Simply Wall St has no position in any stocks mentioned.
