
 Yahoo Finance
 Strong week for Metis Energy (SGX:L02) shareholders doesn't alleviate pain of one-year loss
Metis Energy Limited (SGX:L02) shareholders should be happy to see the share price up 19% in the last week. But that's small comfort given the dismal price performance over the last year. Like a receding glacier in a warming world, the share price has melted 58% in that period. It's not that amazing to see a bounce after a drop like that. It may be that the fall was an overreaction.
While the last year has been tough for Metis Energy shareholders, this past week has shown signs of promise. So let's look at the longer term fundamentals and see if they've been the driver of the negative returns.
See our latest analysis for Metis Energy
To quote Buffett, 'Ships will sail around the world but the Flat Earth Society will flourish. There will continue to be wide discrepancies between price and value in the marketplace...' One imperfect but simple way to consider how the market perception of a company has shifted is to compare the change in the earnings per share (EPS) with the share price movement.
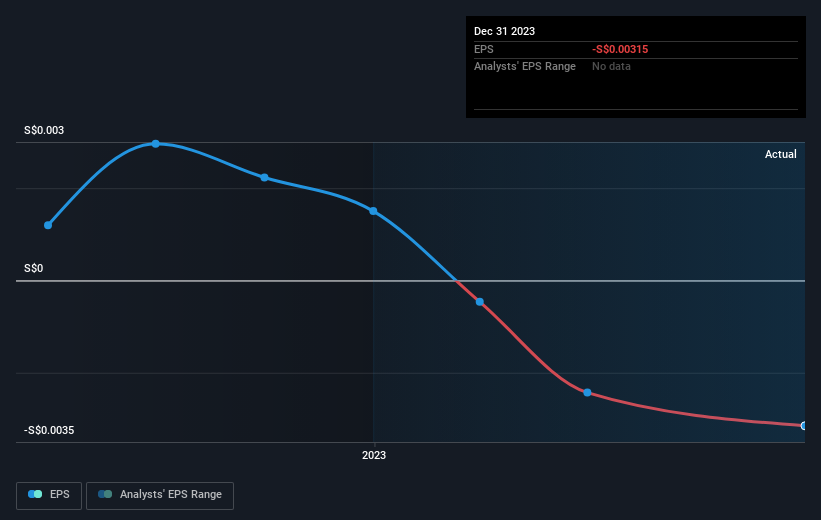
Metis Energy fell to a loss making position during the year. Buyers no doubt think it's a temporary situation, but those with a nose for quality have low tolerance for losses. However, there may be an opportunity for investors if the company can recover.
You can see how EPS has changed over time in the image below (click on the chart to see the exact values).
Before buying or selling a stock, we always recommend a close examination of historic growth trends, available here.
A Different Perspective
Investors in Metis Energy had a tough year, with a total loss of 58%, against a market gain of about 1.4%. However, keep in mind that even the best stocks will sometimes underperform the market over a twelve month period. On the bright side, long term shareholders have made money, with a gain of 0.8% per year over half a decade. If the fundamental data continues to indicate long term sustainable growth, the current sell-off could be an opportunity worth considering. I find it very interesting to look at share price over the long term as a proxy for business performance. But to truly gain insight, we need to consider other information, too. Consider for instance, the ever-present spectre of investment risk. We've identified 3 warning signs with Metis Energy (at least 1 which is a bit concerning) , and understanding them should be part of your investment process.
If you like to buy stocks alongside management, then you might just love this free list of companies. (Hint: insiders have been buying them).
Please note, the market returns quoted in this article reflect the market weighted average returns of stocks that currently trade on Singaporean exchanges.
Have feedback on this article? Concerned about the content? Get in touch with us directly. Alternatively, email editorial-team (at) simplywallst.com.
This article by Simply Wall St is general in nature. We provide commentary based on historical data and analyst forecasts only using an unbiased methodology and our articles are not intended to be financial advice. It does not constitute a recommendation to buy or sell any stock, and does not take account of your objectives, or your financial situation. We aim to bring you long-term focused analysis driven by fundamental data. Note that our analysis may not factor in the latest price-sensitive company announcements or qualitative material. Simply Wall St has no position in any stocks mentioned.
