
 Yahoo Finance
 Are Strong Financial Prospects The Force That Is Driving The Momentum In Fairfax Financial Holdings Limited's TSE:FFH) Stock?
Fairfax Financial Holdings (TSE:FFH) has had a great run on the share market with its stock up by a significant 20% over the last three months. Given the company's impressive performance, we decided to study its financial indicators more closely as a company's financial health over the long-term usually dictates market outcomes. Particularly, we will be paying attention to Fairfax Financial Holdings' ROE today.
Return on Equity or ROE is a test of how effectively a company is growing its value and managing investors’ money. In simpler terms, it measures the profitability of a company in relation to shareholder's equity.
Check out our latest analysis for Fairfax Financial Holdings
How Do You Calculate Return On Equity?
The formula for ROE is:
Return on Equity = Net Profit (from continuing operations) ÷ Shareholders' Equity
So, based on the above formula, the ROE for Fairfax Financial Holdings is:
18% = US$5.1b ÷ US$28b (Based on the trailing twelve months to December 2023).
The 'return' is the profit over the last twelve months. That means that for every CA$1 worth of shareholders' equity, the company generated CA$0.18 in profit.
What Has ROE Got To Do With Earnings Growth?
We have already established that ROE serves as an efficient profit-generating gauge for a company's future earnings. We now need to evaluate how much profit the company reinvests or "retains" for future growth which then gives us an idea about the growth potential of the company. Assuming all else is equal, companies that have both a higher return on equity and higher profit retention are usually the ones that have a higher growth rate when compared to companies that don't have the same features.
Fairfax Financial Holdings' Earnings Growth And 18% ROE
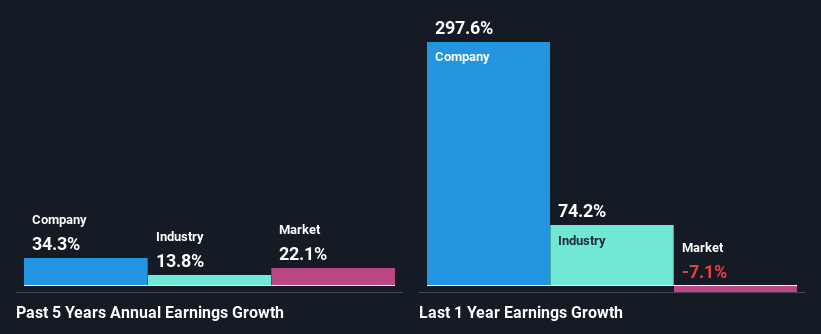
To start with, Fairfax Financial Holdings' ROE looks acceptable. Especially when compared to the industry average of 12% the company's ROE looks pretty impressive. Probably as a result of this, Fairfax Financial Holdings was able to see an impressive net income growth of 34% over the last five years. We reckon that there could also be other factors at play here. Such as - high earnings retention or an efficient management in place.
Next, on comparing with the industry net income growth, we found that Fairfax Financial Holdings' growth is quite high when compared to the industry average growth of 14% in the same period, which is great to see.
The basis for attaching value to a company is, to a great extent, tied to its earnings growth. It’s important for an investor to know whether the market has priced in the company's expected earnings growth (or decline). By doing so, they will have an idea if the stock is headed into clear blue waters or if swampy waters await. If you're wondering about Fairfax Financial Holdings''s valuation, check out this gauge of its price-to-earnings ratio, as compared to its industry.
Is Fairfax Financial Holdings Using Its Retained Earnings Effectively?
Fairfax Financial Holdings' ' three-year median payout ratio is on the lower side at 9.2% implying that it is retaining a higher percentage (91%) of its profits. So it seems like the management is reinvesting profits heavily to grow its business and this reflects in its earnings growth number.
Moreover, Fairfax Financial Holdings is determined to keep sharing its profits with shareholders which we infer from its long history of paying a dividend for at least ten years. Our latest analyst data shows that the future payout ratio of the company is expected to rise to 19% over the next three years. Consequently, the higher expected payout ratio explains the decline in the company's expected ROE (to 6.6%) over the same period.
Conclusion
In total, we are pretty happy with Fairfax Financial Holdings' performance. Specifically, we like that the company is reinvesting a huge chunk of its profits at a high rate of return. This of course has caused the company to see substantial growth in its earnings. That being so, according to the latest industry analyst forecasts, the company's earnings are expected to shrink in the future. To know more about the latest analysts predictions for the company, check out this visualization of analyst forecasts for the company.
Have feedback on this article? Concerned about the content? Get in touch with us directly. Alternatively, email editorial-team (at) simplywallst.com.
This article by Simply Wall St is general in nature. We provide commentary based on historical data and analyst forecasts only using an unbiased methodology and our articles are not intended to be financial advice. It does not constitute a recommendation to buy or sell any stock, and does not take account of your objectives, or your financial situation. We aim to bring you long-term focused analysis driven by fundamental data. Note that our analysis may not factor in the latest price-sensitive company announcements or qualitative material. Simply Wall St has no position in any stocks mentioned.
