
 Yahoo Finance
 Straits Times Index shows short-term weakness, US risk-free rates shows downward bias

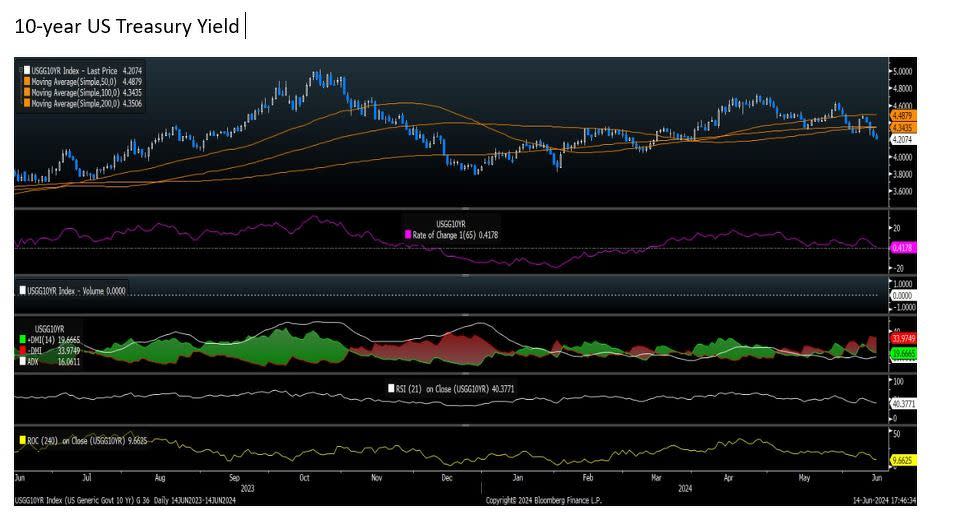
US risk-free rates have fallen below their 50-, 100- and 200-day moving averages and are testing the neckline of a top.
The Straits Times Index fell some 30 points week-on-week and closed at 3,297, a tad below a secondary support area at 3,300. The 50-day moving average is at 3,280, and rising at around 3 points a day. That would put the STI at the 50-day moving average within a week.
Since short term indicators are at their equilibrium lines, and quarterly momentum has turned down but remains above its equilibrium line, the index could ease a bit further before staging a rebound. The most likely scenario is that prices move towards 3,290 before rebounding. For the time being, the upside of 3,450, indicated after the break above 3,250, and the move above 3,300, remains valid.
Although the FOMC minutes tilted towards hawkish, DBS Group Research maintains its view that two rate cuts are possible this year. For one thing, on the day after the Federal Reserve’s hawkish bent, producer price index (PPI) figures showed a continued decline in May. The final PPI figure in the US rose by 2.2% on a yearly basis in May, below market expectations of 2.5%, and lower than April’s reading of 2.3%.
“The May inflation data (CPI was flat, month-over-month), released the same day as FOMC meeting, should give some comfort to the inflation picture,” DBS says. “We think by the time the September policy meeting takes place, there will be plenty of data available for FOMC members to see that inflation worries have abated largely. From manufacturers’ input price to insurance costs, rentals to medical services, as well pump price of gasoline, there is room for stable or receding inflation outcome in the coming months, in our view. A September cut could be readily followed by one in December, in this scenario,” DBS points out.
In the meantime, the US markets have made new highs during the week of June 10-14. And, despite the US Federal Reserve’s hawkish tilt, the markets are expecting lower rates. The US risk-free rate as represented by the 10-year treasury yield is at 4.20% as at June 14. The 10-year treasury yield has fallen below the confluence of its 100- and 200-day moving averages at 4.34% and 4.35% respectively. Since the 200-day and 100-day moving averages appear to have made a negative cross, with the 100-day below the 200-day, further weakness in the 10-year yield is likely.
Additionally, the 10-year yield may attempt to fall below 4.20%, which represents the neckline of a top formation.
See Also:
Click here to stay updated with the Latest Business & Investment News in Singapore
As US risk-free rates slump, Straits Times Index sees mild consolidation
STI could move gradually higher during the summer despite the Fed’s high-for-longer stance
Get in-depth insights from our expert contributors, and dive into financial and economic trends
