
 Yahoo Finance
 Stitch Fix (SFIX) Q2 Loss Widens & Revenues Decrease Y/Y
Stitch Fix, Inc. SFIX posted dismal second-quarter fiscal 2023 results. SFIX reported a wider-than-expected loss per share and lower-than-expected revenues. Both metrics also deteriorated from the year-earlier quarter’s reported figures. Results were hurt by a tough macroeconomic backdrop and tighter consumer wallet.
Following the dismal results, Stitch Fix shares declined 7.9% after the trading session on Mar 7.
Q2 Details
Stitch Fix posted a loss of 58 cents a share, which included restructuring cost and other one-time cost. Adjusting for the above-mentioned costs, Stitch Fix reported adjusted loss of 34 cents a share, wider than the Zacks Consensus Estimate of a loss of 33 cents. The bottom line widened year over year from a loss of 28 cents per share.
SFIX recorded net revenues of $412.1 million which was in line with the Zacks Consensus Estimate. The metric declined 20% from the year-ago fiscal quarter’s figure due to lower net active clients and higher promotional activity.
Stitch Fix, Inc. Price, Consensus and EPS Surprise
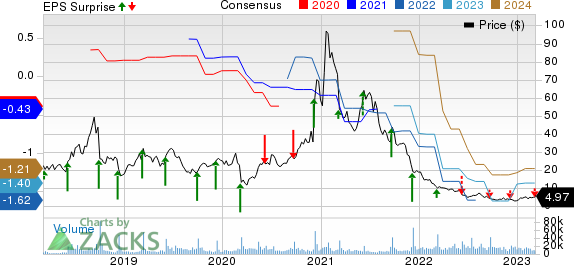
Stitch Fix, Inc. price-consensus-eps-surprise-chart | Stitch Fix, Inc. Quote
Margins & Costs
In the fiscal second quarter, gross profit declined to $169.1 million from $232.8 million reported in the year-ago period. Also, the gross margin contracted 400 basis points year over year to 41% mainly due to increased promotional activity and higher product cost.
Selling, general and administrative expenses fell from $263.5 million reported in the year-ago period to $235.8 million in the fiscal second quarter. Stitch Fix reported an adjusted EBITDA of $3.8 million for the fiscal quarter under review compared with the adjusted EBITDA of $10.1 million posted in the year-ago fiscal quarter. The company’s total advertisement spend declined 46% year over year to 5% in the fiscal second quarter.
Other Financial Aspects
Stitch Fix ended the fiscal second quarter with cash and cash equivalents, including short term investments of $222 million, net inventory of $159 million and shareholders’ equity of $255.3 million.
SFIX generated $11 million in cash from operating activities during the second quarter of fiscal 2023. Also, the company had a free cash flow of $15.4 million in the aforementioned period.
Outlook
For the third quarter of fiscal 2023, management projects net revenues of $385-$395 million, indicating a 20-22% decline from the year-ago fiscal quarter’s reported figure. This is due to challenges faced in the highly promotional operating environment. Stitch Fix expects adjusted EBITDA in the bracket of a negative $5 million to a positive $5 million with a margin of minus 1% to plus 1%.
For fiscal 2023, management projects revenues between $1.625 billion and $1.645 billion and adjusted EBITDA between breakeven to a positive $10 million. Management anticipates a gross margin of 42% for fiscal 2023. For the rest of the fiscal year, advertising is likely to be approximately 6-7% of revenues. The company is in line to achieve its target of $135 million in cost reduction in fiscal 2023.
This Zacks Rank #2 (Buy) stock has rallied 28.1% in the past three months compared with industry’s rise of 4%.
Stocks to Consider
Here we highlighted three better-ranked stocks, namely Ulta Beauty, Inc. ULTA, Deckers Outdoor Corporation DECK and The Kroger Co. KR.
Ulta Beauty currently carries a Zacks Rank #2. You can see the complete list of today’s Zacks Rank #1 (Strong Buy) stocks here.
The Zacks Consensus Estimate for Ulta Beauty’s current financial-year sales suggests growth of 15.8% from the year-ago period. This beauty retailer and the premier beauty destination for cosmetics, fragrance, skincare products, hair care products and salon services have a trailing four-quarter earnings surprise of 26.2%, on average.
Deckers is a leading designer, producer and brand manager of innovative, niche footwear and accessories developed for outdoor sports and other lifestyle-related activities. DECK has a Zacks Rank #2 at present.
The Zacks Consensus Estimate for Deckers’ current financial-year sales and EPS suggests growth of 12.2% and 13.6%, respectively, from the year-ago corresponding figures. DECK has a trailing four-quarter earnings surprise of 31%, on average.
Kroger, which operates in the thin-margin grocery industry, carries a Zacks Rank of 2 at present. KR’s current financial-year revenues and EPS suggests growth of 2.6% and 5%, respectively. KR gave an earnings surprise of 10% in the last reported quarter. KR has a trailing four-quarter earnings surprise of 9.76%, on average.
Want the latest recommendations from Zacks Investment Research? Today, you can download 7 Best Stocks for the Next 30 Days. Click to get this free report
Deckers Outdoor Corporation (DECK) : Free Stock Analysis Report
The Kroger Co. (KR) : Free Stock Analysis Report
Ulta Beauty Inc. (ULTA) : Free Stock Analysis Report
Stitch Fix, Inc. (SFIX) : Free Stock Analysis Report