
 Yahoo Finance
 Star Energy Group Full Year 2023 Earnings: EPS Misses Expectations
Star Energy Group (LON:STAR) Full Year 2023 Results
Key Financial Results
Revenue: UK£49.5m (down 16% from FY 2022).
Net loss: UK£4.49m (loss narrowed by 62% from FY 2022).
UK£0.035 loss per share (improved from UK£0.094 loss in FY 2022).
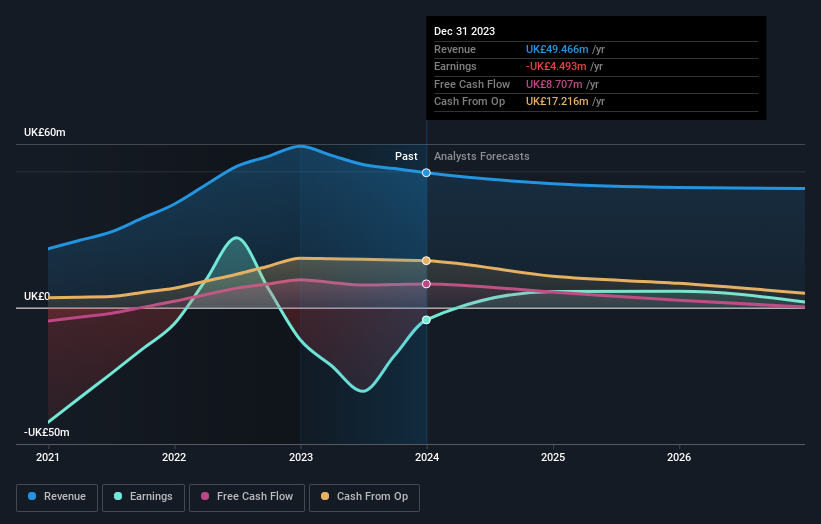
All figures shown in the chart above are for the trailing 12 month (TTM) period
Star Energy Group EPS Misses Expectations
Revenue was in line with analyst estimates. Earnings per share (EPS) missed analyst estimates.
Looking ahead, revenue is expected to fall by 4.5% p.a. on average during the next 3 years compared to a 1.4% decline forecast for the Oil and Gas industry in the United Kingdom.
Performance of the British Oil and Gas industry.
The company's shares are up 3.1% from a week ago.
Risk Analysis
We should say that we've discovered 2 warning signs for Star Energy Group that you should be aware of before investing here.
Have feedback on this article? Concerned about the content? Get in touch with us directly. Alternatively, email editorial-team (at) simplywallst.com.
This article by Simply Wall St is general in nature. We provide commentary based on historical data and analyst forecasts only using an unbiased methodology and our articles are not intended to be financial advice. It does not constitute a recommendation to buy or sell any stock, and does not take account of your objectives, or your financial situation. We aim to bring you long-term focused analysis driven by fundamental data. Note that our analysis may not factor in the latest price-sensitive company announcements or qualitative material. Simply Wall St has no position in any stocks mentioned.
