
 Yahoo Finance
 Spindex Industries (SGX:564) Is Reinvesting At Lower Rates Of Return
If you're not sure where to start when looking for the next multi-bagger, there are a few key trends you should keep an eye out for. Firstly, we'll want to see a proven return on capital employed (ROCE) that is increasing, and secondly, an expanding base of capital employed. If you see this, it typically means it's a company with a great business model and plenty of profitable reinvestment opportunities. However, after investigating Spindex Industries (SGX:564), we don't think it's current trends fit the mold of a multi-bagger.
Understanding Return On Capital Employed (ROCE)
For those who don't know, ROCE is a measure of a company's yearly pre-tax profit (its return), relative to the capital employed in the business. To calculate this metric for Spindex Industries, this is the formula:
Return on Capital Employed = Earnings Before Interest and Tax (EBIT) ÷ (Total Assets - Current Liabilities)
0.09 = S$15m ÷ (S$206m - S$44m) (Based on the trailing twelve months to December 2023).
Therefore, Spindex Industries has an ROCE of 9.0%. On its own that's a low return, but compared to the average of 6.9% generated by the Machinery industry, it's much better.
Check out our latest analysis for Spindex Industries
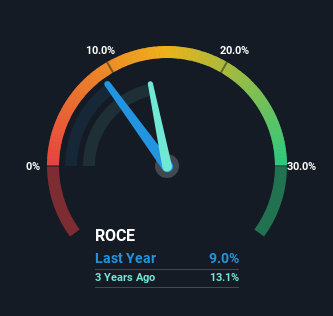
Historical performance is a great place to start when researching a stock so above you can see the gauge for Spindex Industries' ROCE against it's prior returns. If you'd like to look at how Spindex Industries has performed in the past in other metrics, you can view this free graph of Spindex Industries' past earnings, revenue and cash flow.
What Does the ROCE Trend For Spindex Industries Tell Us?
When we looked at the ROCE trend at Spindex Industries, we didn't gain much confidence. Around five years ago the returns on capital were 13%, but since then they've fallen to 9.0%. Meanwhile, the business is utilizing more capital but this hasn't moved the needle much in terms of sales in the past 12 months, so this could reflect longer term investments. It's worth keeping an eye on the company's earnings from here on to see if these investments do end up contributing to the bottom line.
The Bottom Line On Spindex Industries' ROCE
Bringing it all together, while we're somewhat encouraged by Spindex Industries' reinvestment in its own business, we're aware that returns are shrinking. Unsurprisingly, the stock has only gained 4.1% over the last five years, which potentially indicates that investors are accounting for this going forward. As a result, if you're hunting for a multi-bagger, we think you'd have more luck elsewhere.
If you'd like to know more about Spindex Industries, we've spotted 3 warning signs, and 2 of them are concerning.
While Spindex Industries isn't earning the highest return, check out this free list of companies that are earning high returns on equity with solid balance sheets.
Have feedback on this article? Concerned about the content? Get in touch with us directly. Alternatively, email editorial-team (at) simplywallst.com.
This article by Simply Wall St is general in nature. We provide commentary based on historical data and analyst forecasts only using an unbiased methodology and our articles are not intended to be financial advice. It does not constitute a recommendation to buy or sell any stock, and does not take account of your objectives, or your financial situation. We aim to bring you long-term focused analysis driven by fundamental data. Note that our analysis may not factor in the latest price-sensitive company announcements or qualitative material. Simply Wall St has no position in any stocks mentioned.
