
 Yahoo Finance
 Spectrum Brands (SPB) Posts Narrower Q2 Loss, Misses on Sales
Spectrum Brands Holdings Inc. SPB came out with second-quarter fiscal 2023 results, wherein the bottom line surpassed the Zacks Consensus Estimate, while sales missed the same. Both metrics fell year over year. Results were hurt by lower first-half demand and inventory reduction.
However, shares of the Zacks Rank #3 (Hold) company have gained 9.3% in the past three months against the industry's decline of 9.1%.
Q2 Highlights
The company reported an adjusted loss of 14 cents per share against earnings of 41 cents in the year-ago period due to lower adjusted EBITDA. The reported loss was narrower than the Zacks Consensus Estimate of a loss of 23 cents and our estimate of a loss of 11 cents.
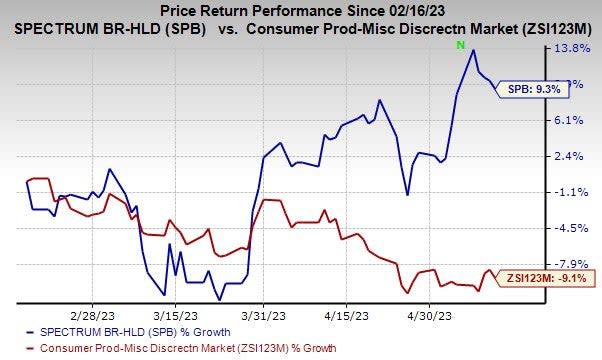
Image Source: Zacks Investment Research
Spectrum Brands' net sales fell 9.7% year over year to $729.2 million and lagged the Zacks Consensus Estimate of $767 million and our estimate of $780.6 million. Acquisition-related gains of $22.1 million aided the top line, while adverse foreign currency impacts of $19.4 million remained a drag. Organic net sales declined 10.1%. The downside was mainly due to retailer inventory management strategies and slower category POS, offset by positive pricing.
The gross profit decreased 16.1% year over year to $214.5 million, while the gross margin contracted 220 basis points (bps) year over year to 29.4% due to a decline in sales volume, unfavorable mix and sales of higher cost inventory accumulated in the prior year, which more than offset pricing actions.
SG&A expenses fell 14.2% to $219.3 million. As a percentage of sales, SG&A expenses contracted 150 bps to 30.1%.
The company’s operating loss was $77 million compared with the prior-year quarter’s loss of $8.1 million due to an intangible asset impairment of $67 million, offset by lower distribution costs, fixed-cost reduction efforts, and reduced project spend on restructuring, optimization and strategic transaction initiatives.
Adjusted EBITDA plunged 35.4% to $51 million in the fiscal second quarter. The adjusted EBITDA margin contracted 280 bps to 7% due to reduced volume and currency headwinds.
Segmental Performance
Sales in the Home & Personal Care segment decreased 11.7% to $279.2 million due to a category decline from lower demand, particularly in kitchen appliances, and continued retailer inventory management in North America. Excluding the $22.1-million gain from the acquisition and the $11.8-million impact of adverse currency rates, organic net sales for the segment fell 14.9%.
The segment's adjusted EBITDA came in at a loss of $1.9 million against earnings of $10.6 million. Meanwhile, adjusted EBITDA margins contracted 410 bps year over year to 0.7% due to lower volume, the sales of higher cost inventory accumulated in the prior year and unfavorable foreign currency in EMEA, partly offset by cost savings and additional actions undertaken during the quarter.
The Global Pet Care segment's sales inched down 0.5% year over year to $296.7 million, driven by strong growth in companion animals stemming from strength in chews in North America, and Dog and Cat food in EMEA, partly offset by declines in other hard goods and aquatic environments. Excluding the $7.6-million impact of unfavorable foreign currency, organic sales rose 3.1%.
The segment's adjusted EBITDA grew 5.7% to $46.3, while the adjusted EBITDA margin expanded 180 bps year over year to 15.6%, driven by lower distribution costs, positive pricing, savings from the prior year’s cost-reduction initiatives and additional cost-reduction actions.
The Home & Garden segment's sales declined 22% to $153.3 million due to a reduction in retailer inventory and adverse weather conditions. Also, drab cleaning products sales in the spring season led to a POS decline in the relevant categories. The segment's adjusted EBITDA of $15.1 million decreased 60% from $37.7 million in the prior-year quarter due to a sales decline, which was offset by gains from fixed-cost restructuring and operational cost reductions initiated in the second half of last year.
Other Financials
As of Apr 2, 2023, the company’s cash balance was $328 million, with an outstanding debt of $3,222 million. It has $362 million available on its $1.1-billion cash flow revolver. In a recent development, SPB announced a quarterly dividend of 42 cents per share, payable Jun 8, 2023, to shareholders of record as of May 23, 2023.
Spectrum Brands Holdings Inc. Price, Consensus and EPS Surprise
Spectrum Brands Holdings Inc. price-consensus-eps-surprise-chart | Spectrum Brands Holdings Inc. Quote
Guidance
Spectrum Brands updated its guidance for fiscal 2023. The company expects a mid-single-digit sales decline, down from the prior stated low-single-digit growth. This includes the adverse impacts of foreign currency. Adjusted EBITDA is likely to decline in the low to mid-single digits, down from the earlier mentioned low-double-digit growth.
Depreciation and amortization are predicted to be $105-$115 million, including stock-based compensation of $7-$12 million. Interest expenses are forecast to be $120-$125 million, including $5 million of non-cash items. Cash payments toward restructuring, optimization, and strategic transaction costs are anticipated to be $65-$70 million. Capital expenditure is likely to be
$55-$65 million. The tax rate is expected to be 25%.
Stocks to Consider
Some better-ranked companies are Crocs CROX, PVH Corp PVH and MGM Resorts MGM.
MGM Resorts currently sports a Zacks Rank #1 (Strong Buy). The company has a trailing four-quarter earnings surprise of 81%, on average. You can see the complete list of today’s Zacks #1 Rank stocks here.
The Zacks Consensus Estimate for MGM’s 2024 sales and EPS indicates increases of 2.2% and 31%, respectively, from those estimated for 2023.
Crocs, which offers casual lifestyle footwear and accessories, carries a Zacks Rank #2 (Buy). The expected EPS growth rate for three to five years is 15%.
The Zacks Consensus Estimate for Crocs’ current financial-year sales and earnings suggests growth of 13.1% and 2.8% from the year-ago period. CROX has a trailing four-quarter earnings surprise of 21.8%, on average.
PVH Corp currently carries a Zacks Rank #2. PVH has a trailing four-quarter earnings surprise of 23.4%, on average. PVH has a long-term earnings growth rate of 16.1%.
The Zacks Consensus Estimate for PVH Corp’s current financial year’s sales and EPS indicates declines of 3.8% and 9.8%, respectively, from the year-ago period’s reported levels.
Want the latest recommendations from Zacks Investment Research? Today, you can download 7 Best Stocks for the Next 30 Days. Click to get this free report
MGM Resorts International (MGM) : Free Stock Analysis Report
PVH Corp. (PVH) : Free Stock Analysis Report
Crocs, Inc. (CROX) : Free Stock Analysis Report
Spectrum Brands Holdings Inc. (SPB) : Free Stock Analysis Report
