
 Yahoo Finance
 SONY's Q4 Earnings and Revenues Increase Y/Y, Shares Up
Sony Group Corporation SONY reported fourth-quarter fiscal 2021 net income per share (on a GAAP basis) of ¥88.98 (77 cents) per share, which increased 67% year over year. The uptick can be attributed to year-over-year top-line growth. The Zacks Consensus Estimate stood at 82 cents.
Adjusted net income came in at ¥78.6 billion compared with ¥43.4 billion in the prior-year quarter.
Quarterly total revenues inched up 1% year over year to ¥2,264 billion ($19,486.3 million). The Zacks consensus estimate was $20,818.7 million.
In fiscal 2021, revenues came in at ¥9,921.5 billion, up 10.3% from the prior year’s period, driven by higher sales from Pictures, Entertainment, Technology & Services and Music segment’s sales.
Following the announcement, shares of Sony are up 3% in the premarket trading on May 10. In the past year, the company’s stock has lost 15.8% of its value compared with the industry’s decline of 18.6%.
Sony Corporation Price, Consensus and EPS Surprise
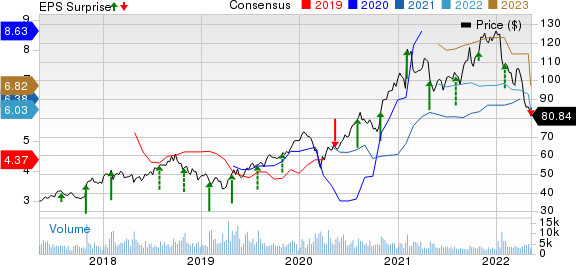
Sony Corporation price-consensus-eps-surprise-chart | Sony Corporation Quote
Segment Results
In the quarter under review, Game & Network Services (G&NS) sales were up 0.8% year over year to ¥665.3 billion. The segment’s operating income was ¥87.3 billion compared with ¥31.7 billion in the prior-year quarter.
In the fiscal year, sales in the segment were up 3%, driven by increases in hardware sales. However, software sales declined, which included revenues from non-first-party titles and add-on content.
Music sales increased 10.2% year over year to ¥294.6 billion in the fiscal fourth quarter. Operating income was ¥49.9 billion, up from ¥35.8 billion in the prior-year quarter.
In the fiscal year, sales from the segment were up 19%, owing to higher recorded music and music publishing sales, increased revenues from paid subscription streaming services and a rise in revenues from advertising-supported streaming services. The positive impact of foreign exchange rates was a tailwind as well.
Pictures sales surged 55.9% year over year to ¥312.2 billion. Operating income was ¥11 billion compared with an operating loss of ¥0.3 billion a year ago.
In the fiscal year, sales from the segment were up 64.5%, driven by higher sales of motion pictures, television products, higher theatrical revenues and licensing revenues from digital streaming services for new film titles and higher licensing revenues for catalog products and the Crunchyroll acquisition.
Entertainment, Technology & Services (ET&S) sales came in at ¥494.1 billion, up 4.2% year over year. Operating loss was ¥11.6 billion compared with ¥20 billion in the year-ago quarter.
For the fiscal year, sales from the segment were up 13% due to an increase in sales of televisions and digital cameras, favorable product mix and a positive impact of foreign exchange rates.
Imaging & Sensing Solutions sales were up 9.9% year over year to ¥255.3 billion. Operating income was ¥10.7 billion compared with ¥17.5 billion in the prior-year quarter.
For the fiscal year, sales from the segment were up 6% due to an increase in sales of image sensors for industrial equipment and digital cameras. However, a decline in sales of image sensors for mobile products acted as a headwind.
Financial Services sales were down 36.4% year over year to ¥279.7 billion. Operating income was ¥47.8 billion compared with ¥41.9 billion in the year-ago quarter.
For the fiscal year, sales from the segment were down 8%, which reflects a decline in revenues at Sony Life and a fall in net gains on investments in the separate accounts.
All Other sales were up 28.4% to ¥24.9 billion in the fiscal fourth quarter. Operating loss was ¥3 billion compared with ¥4.9 billion in the year-ago quarter.
Other Details
For the quarter under review, total expenses were ¥2,128.9 billion, down 2.1% year over year. Operating income was ¥138.6 billion, up 109%.
Cash Flow & Liquidity
For fiscal 2021, Sony generated ¥813.3 billion of cash from operating activities compared with ¥1,150.3 billion in the prior fiscal year. Free cash flow came in at ¥102.1 billion compared with ¥608 billion in the prior fiscal year.
As of Mar 31, 2022, the company had ¥2,049.6 billion in cash and cash equivalents with ¥1,203.6 billion of long-term debt.
FY22 Outlook
Sony has provided the outlook for the fiscal year ending Mar 31, 2023. It expects sales of ¥11,400 billion, up 15% year over year. The top-line performance is likely to be driven by significant improvement in G&NS and I&SS segment sales
Operating income is projected to be ¥1,160 billion, down 4% year over year. Net income is estimated to be ¥830 billion, declining 6% year over year.
Operating Cash Flow is expected to be ¥1,050 billion, up 29% from the prior fiscal year.
Zacks Rank & Stocks to Consider
Sony currently carries a Zacks Rank #3 (Hold).
Some better-ranked stocks from the broader technology sector are Flex FLEX, Jabil JBL and Broadcom AVGO. Jabil sports a Zacks Rank #1 (Strong Buy), while Flex and Broadcom carries a Zacks Rank of 2 (Buy). You can see the complete list of today’s Zacks #1 Rank stocks here.
The Zacks Consensus Estimate for Flex’s fiscal 2023 earnings is pegged at $2.15 per share, up 6.4% in the past 60 days. The long-term earnings growth rate is pegged at 14.9%.
Flex’s earnings beat the Zacks Consensus Estimate all last four quarters, with the average being 21.1%. Shares of FLEX have declined 10.6% in the past year.
The Zacks Consensus Estimate for Jabil fiscal 2022 earnings is pegged at $7.25 per share, up 10.2% in the past 60 days. The long-term earnings growth rate is 12%.
Jabil’s earnings beat the Zacks Consensus Estimate all last four quarters, with the average being 13.5%. Shares of JBL have gained 5.6% in the past year.
The Zacks Consensus Estimate for Broadcom’s fiscal 2022 earnings is pegged at $35.67 per share, up 0.5% in the past 60 days. AVGO’s long-term earnings growth rate is pegged at 15.6%.
Broadcom’s earnings beat the Zacks Consensus Estimate in all the preceding four quarters, with the average being 1.9%. Shares of AVGO have increased 27.9% in the past year
Want the latest recommendations from Zacks Investment Research? Today, you can download 7 Best Stocks for the Next 30 Days. Click to get this free report
Jabil, Inc. (JBL) : Free Stock Analysis Report
Flex Ltd. (FLEX) : Free Stock Analysis Report
Broadcom Inc. (AVGO) : Free Stock Analysis Report
Sony Corporation (SONY) : Free Stock Analysis Report
To read this article on Zacks.com click here.
Zacks Investment Research
