
 Yahoo Finance
 SM Energy (SM) Shares Resilient Following Q1 Earnings Beat
SM Energy Company’s SM shares — which declined 11.2% after the announcement of better-than-expected first-quarter 2021 results on Apr 29 — have risen 12.6% since then. Investors expect production for the rest of the year to increase.
The company reported first-quarter adjusted loss of 5 cents per share, narrower than the Zacks Consensus Estimate of a loss of 23 cents. Notably, the bottom line remained flat with the year-ago period.
Quarterly revenues of $443.8 million increased from $355.7 million in the year-ago quarter and beat the Zacks Consensus Estimate of $339 million.
The better-than-expected results can be attributed to an increase in realized commodity prices, and decreased costs and operating expenses. The positives were partially offset by a decline in production volumes.
SM Energy Company Price, Consensus and EPS Surprise
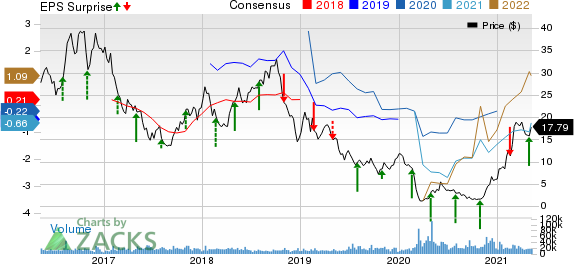
SM Energy Company price-consensus-eps-surprise-chart | SM Energy Company Quote
Operational Performance:
Total Production
SM Energy’s first-quarter production totaled 111.6 thousand barrels of oil equivalent per day (MBoe/d) (54% oil), down 18% from the year-ago level of 135.9 MBoe/d.
Oil production decreased 14% year over year to 60.3 thousand barrels per day (MBbls/d). The company produced 239.4 million cubic feet per day of natural gas in the quarter, down 18% year over year. Natural gas liquids contributed 11.4 MBbls/d to total production volume, down 35% from the first-quarter 2020 level.
Realized Prices
Before the effects of derivative settlements, the average realized price per Boe was $42.11 compared with $28.64 in the year-ago quarter. Average realized price of natural gas surged 170% year over year to $4.16 per thousand cubic feet. Notably, average realized prices of oil increased 23% to $56.33 per barrel and that of natural gas liquids grew 98% from the prior-year quarter to $26.93.
Cost & Expenses
On the cost front, unit lease operating expenses decreased 2% year over year to $4.64 per Boe. In addition, transportation expenses fell to $2.94 per Boe from $3.11 in the year-ago quarter. However, general and administrative expenses increased 11% to $2.46 per Boe from the prior-year level of $2.22.
Total exploration expenses were $9.3 million, lower than the year-ago figure of $11.3 million. Hydrocarbon production expenses for the quarter were recorded at $100.9 million compared with the year-ago level of $119.6 million. Notably, total operating expenses for the quarter decreased to $654.8 million from the year-ago period’s $836.8 million.
Capex
Capital expenditure for the first quarter was recorded at $147.6 million, higher than the year-ago figure of $139.3 million. Notably, it generated free cash outflow of $27.9 million in the quarter versus the year-ago free cash flow figure of $80.5 million.
Balance Sheet
As of Mar 31, 2021, the company had $2,321.7 million in net debt but no cash and cash equivalents. It had total liquidity of $965 million.
Guidance
SM Energy's 2021 capital expenditure is expected within $650-$675 million. Total production will likely be in the range of 129-137 MBoe/d, signaling a rise from the 2020 level of 126.9 MBoe/d. Of the total output, 52-53% will likely be oil.
For 2021, the company expects lease operating expense within $4.50-$5 per Boe, indicating a significant improvement from the 2020 level of $3.97. Transportation costs will likely be in the range of $2.80-$3 per Boe, suggesting a decline from the 2020 figure of $3.06 per Boe. Exploration expense for 2021 is expected to be $50 million.
For second quarter, production is expected within 130-134 Mboe/d, of which 53-54% will likely be oil. Capital expenditure for the June quarter is projected in the range of $230-$240 million.
Zacks Rank & Stocks to Consider
The company currently has a Zacks Rank #3 (Hold). Some better-ranked players in the energy space include National Energy Services Reunited Corp. NESR, NOW Inc. DNOW and Hess Corporation HES, each having a Zacks Rank #2 (Buy). You can see the complete list of today’s Zacks #1 Rank (Strong Buy) stocks here.
National Energy’s bottom line for 2021 is expected to rise 49.2% year over year.
NOW’s bottom line for 2021 is expected to rise 70.8% year over year.
Hess’ bottom line for 2021 is expected to surge 150.9% year over year.
Zacks Top 10 Stocks for 2021
In addition to the stocks discussed above, would you like to know about our 10 best buy-and-hold tickers for the entirety of 2021?
Last year's 2020Zacks Top 10 Stocks portfolio returned gains as high as +386.8%. Now a brand-new portfolio has been handpicked from over 4,000 companies covered by the Zacks Rank. Don’t miss your chance to get in on these long-term buys.
AccessZacks Top 10 Stocks for 2021 today >>
Want the latest recommendations from Zacks Investment Research? Today, you can download 7 Best Stocks for the Next 30 Days. Click to get this free report
Hess Corporation (HES) : Free Stock Analysis Report
SM Energy Company (SM) : Free Stock Analysis Report
NOW Inc. (DNOW) : Free Stock Analysis Report
NATIONAL ENERGY (NESR) : Free Stock Analysis Report
To read this article on Zacks.com click here.
Zacks Investment Research
