
 Yahoo Finance
 Slowing Rates Of Return At Mosaic (NYSE:MOS) Leave Little Room For Excitement
Did you know there are some financial metrics that can provide clues of a potential multi-bagger? Firstly, we'd want to identify a growing return on capital employed (ROCE) and then alongside that, an ever-increasing base of capital employed. This shows us that it's a compounding machine, able to continually reinvest its earnings back into the business and generate higher returns. Having said that, from a first glance at Mosaic (NYSE:MOS) we aren't jumping out of our chairs at how returns are trending, but let's have a deeper look.
Understanding Return On Capital Employed (ROCE)
Just to clarify if you're unsure, ROCE is a metric for evaluating how much pre-tax income (in percentage terms) a company earns on the capital invested in its business. To calculate this metric for Mosaic, this is the formula:
Return on Capital Employed = Earnings Before Interest and Tax (EBIT) ÷ (Total Assets - Current Liabilities)
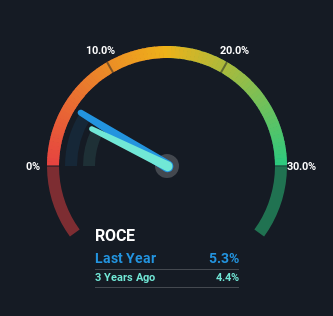
0.053 = US$995m ÷ (US$23b - US$4.0b) (Based on the trailing twelve months to March 2024).
Thus, Mosaic has an ROCE of 5.3%. Ultimately, that's a low return and it under-performs the Chemicals industry average of 9.5%.
Check out our latest analysis for Mosaic
Above you can see how the current ROCE for Mosaic compares to its prior returns on capital, but there's only so much you can tell from the past. If you'd like to see what analysts are forecasting going forward, you should check out our free analyst report for Mosaic .
So How Is Mosaic's ROCE Trending?
Things have been pretty stable at Mosaic, with its capital employed and returns on that capital staying somewhat the same for the last five years. Businesses with these traits tend to be mature and steady operations because they're past the growth phase. So don't be surprised if Mosaic doesn't end up being a multi-bagger in a few years time. This probably explains why Mosaic is paying out 33% of its income to shareholders in the form of dividends. Given the business isn't reinvesting in itself, it makes sense to distribute a portion of earnings among shareholders.
The Key Takeaway
We can conclude that in regards to Mosaic's returns on capital employed and the trends, there isn't much change to report on. Since the stock has gained an impressive 40% over the last five years, investors must think there's better things to come. But if the trajectory of these underlying trends continue, we think the likelihood of it being a multi-bagger from here isn't high.
On a separate note, we've found 2 warning signs for Mosaic you'll probably want to know about.
For those who like to invest in solid companies, check out this free list of companies with solid balance sheets and high returns on equity.
Have feedback on this article? Concerned about the content? Get in touch with us directly. Alternatively, email editorial-team (at) simplywallst.com.
This article by Simply Wall St is general in nature. We provide commentary based on historical data and analyst forecasts only using an unbiased methodology and our articles are not intended to be financial advice. It does not constitute a recommendation to buy or sell any stock, and does not take account of your objectives, or your financial situation. We aim to bring you long-term focused analysis driven by fundamental data. Note that our analysis may not factor in the latest price-sensitive company announcements or qualitative material. Simply Wall St has no position in any stocks mentioned.
