
 Yahoo Finance
 Sinarmas Land Full Year 2023 Earnings: EPS: S$0.064 (vs S$0.081 in FY 2022)
Sinarmas Land (SGX:A26) Full Year 2023 Results
Key Financial Results
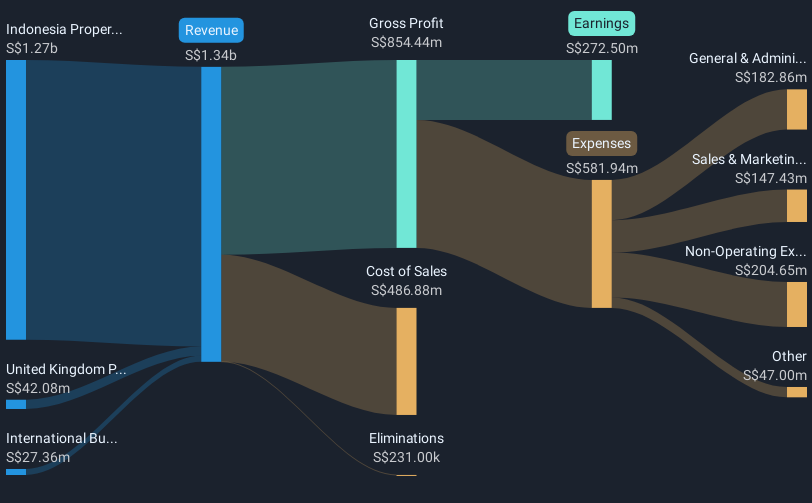
Revenue: S$1.34b (up 7.9% from FY 2022).
Net income: S$272.5m (down 21% from FY 2022).
Profit margin: 20% (down from 28% in FY 2022). The decrease in margin was driven by higher expenses.
EPS: S$0.064 (down from S$0.081 in FY 2022).
All figures shown in the chart above are for the trailing 12 month (TTM) period
The primary driver behind last 12 months revenue was the Indonesia Property segment contributing a total revenue of S$1.27b (95% of total revenue). The most substantial expense, totaling S$204.6m were related to Non-Operating costs. This indicates that a significant portion of the company's costs is related to non-core activities. Explore how A26's revenue and expenses shape its earnings.
Sinarmas Land shares are down 3.7% from a week ago.
Balance Sheet Analysis
While earnings are important, another area to consider is the balance sheet. We've done some analysis and you can see our take on Sinarmas Land's balance sheet.
Have feedback on this article? Concerned about the content? Get in touch with us directly. Alternatively, email editorial-team (at) simplywallst.com.
This article by Simply Wall St is general in nature. We provide commentary based on historical data and analyst forecasts only using an unbiased methodology and our articles are not intended to be financial advice. It does not constitute a recommendation to buy or sell any stock, and does not take account of your objectives, or your financial situation. We aim to bring you long-term focused analysis driven by fundamental data. Note that our analysis may not factor in the latest price-sensitive company announcements or qualitative material. Simply Wall St has no position in any stocks mentioned.
