
 Yahoo Finance
 Simon Property Group Inc's Dividend Analysis
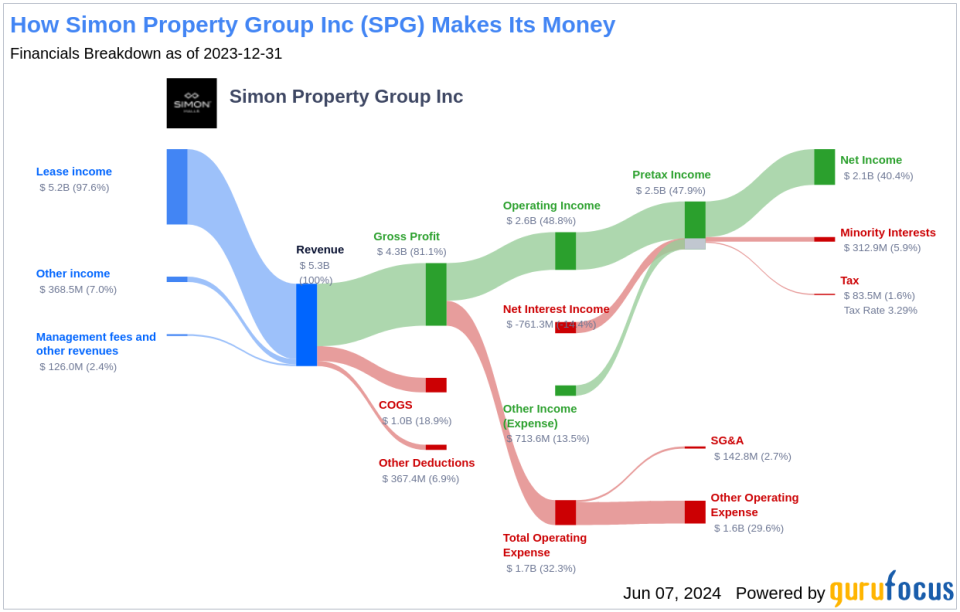
Exploring the Sustainability and Growth of SPG's Dividends
Simon Property Group Inc (NYSE:SPG) recently announced a dividend of $2 per share, payable on 2024-06-28, with the ex-dividend date set for 2024-06-07. As investors look forward to this upcoming payment, the spotlight also shines on the company's dividend history, yield, and growth rates. Using the data from GuruFocus, let's look into Simon Property Group Inc's dividend performance and assess its sustainability.
What Does Simon Property Group Inc Do?
This Powerful Chart Made Peter Lynch 29% A Year For 13 Years
How to calculate the intrinsic value of a stock?
Simon Property Group is the second-largest real estate investment trust in the United States. Its portfolio includes an interest in 230 properties: 136 traditional malls, 69 premium outlets, 14 Mills centers (a combination of a traditional mall, outlet center, and big-box retailers), 6 lifestyle centers, and 5 other retail properties. Simon's portfolio averaged $743 in sales per square foot in 2023 compared with $693 in sales per square foot over the 12 months before the pandemic. The company also owns a 21% interest in Klepierre, a European retail company with investments in shopping centers in 16 countries, and joint-venture interests in 33 premium outlets across 11 countries.
A Glimpse at Simon Property Group Inc's Dividend History
Simon Property Group Inc has maintained a consistent dividend payment record since 1994. Dividends are currently distributed on a quarterly basis. Below is a chart showing annual Dividends Per Share for tracking historical trends.

Breaking Down Simon Property Group Inc's Dividend Yield and Growth
As of today, Simon Property Group Inc currently has a 12-month trailing dividend yield of 4.94% and a 12-month forward dividend yield of 5.19%. This suggests an expectation of increased dividend payments over the next 12 months.
Over the past three years, Simon Property Group Inc's annual dividend growth rate was 16.60%. Extended to a five-year horizon, this rate decreased to -1.20% per year. And over the past decade, Simon Property Group Inc's annual dividends per share growth rate stands at 3.30%.
Based on Simon Property Group Inc's dividend yield and five-year growth rate, the 5-year yield on cost of Simon Property Group Inc stock as of today is approximately 4.65%.

The Sustainability Question: Payout Ratio and Profitability
To assess the sustainability of the dividend, one needs to evaluate the company's payout ratio. The dividend payout ratio provides insights into the portion of earnings the company distributes as dividends. A lower ratio suggests that the company retains a significant part of its earnings, thereby ensuring the availability of funds for future growth and unexpected downturns. As of 2024-03-31, Simon Property Group Inc's dividend payout ratio is 1.35, and this may suggest that the company's dividend may not be sustainable.
Simon Property Group Inc's profitability rank, offers an understanding of the company's earnings prowess relative to its peers. GuruFocus ranks Simon Property Group Inc's profitability 8 out of 10 as of 2024-03-31, suggesting good profitability prospects. The company has reported positive net income for each of year over the past decade, further solidifying its high profitability.
Growth Metrics: The Future Outlook
To ensure the sustainability of dividends, a company must have robust growth metrics. Simon Property Group Inc's growth rank of 8 out of 10 suggests that the company's growth trajectory is good relative to its competitors.
Revenue is the lifeblood of any company, and Simon Property Group Inc's revenue per share, combined with the 3-year revenue growth rate, indicates a strong revenue model. Simon Property Group Inc's revenue has increased by approximately 5.10% per year on average, a rate that outperforms approximately 52.77% of global competitors.
The company's 3-year EPS growth rate showcases its capability to grow its earnings, a critical component for sustaining dividends in the long run. During the past three years, Simon Property Group Inc's earnings increased by approximately 14.60% per year on average, a rate that outperforms approximately 61.88% of global competitors.
Lastly, the company's 5-year EBITDA growth rate of -2.40%, which outperforms approximately 31.64% of global competitors.
Conclusion
Considering Simon Property Group Inc's consistent dividend payments, growth in dividend rates, and strong financial metrics, the company presents an attractive prospect for investors seeking dividend income. However, the sustainability of these dividends will depend on the company's continued profitability and growth. For those looking to explore further, GuruFocus Premium users can screen for high-dividend yield stocks using the High Dividend Yield Screener.
This article, generated by GuruFocus, is designed to provide general insights and is not tailored financial advice. Our commentary is rooted in historical data and analyst projections, utilizing an impartial methodology, and is not intended to serve as specific investment guidance. It does not formulate a recommendation to purchase or divest any stock and does not consider individual investment objectives or financial circumstances. Our objective is to deliver long-term, fundamental data-driven analysis. Be aware that our analysis might not incorporate the most recent, price-sensitive company announcements or qualitative information. GuruFocus holds no position in the stocks mentioned herein.
This article first appeared on GuruFocus.
