
 Yahoo Finance
 Silgan (SLGN) Q1 Earnings Beat Estimates, Revenues Dip Y/Y
Silgan Holdings Inc. SLGN reported adjusted earnings per share (EPS) of 69 cents for first-quarter 2024, beating the Zacks Consensus Estimate of 67 cents. The bottom line decreased 12% year over year but was within the company’s guidance of 60-70 cents. The decline reflected weaker volume performance across all its segments attributed to customer destocking.
Including one-time items, earnings were 52 cents per share compared with 65 cents in the prior-year quarter.
Total revenues decreased 7% year over year to $1.32 billion from the prior-year quarter’s $1.42 billion, reflecting declining volumes and the pass-through of lower raw material costs. The top line missed the Zacks Consensus Estimate of $1.37 billion.
Silgan Holdings Inc. Price, Consensus and EPS Surprise
Silgan Holdings Inc. price-consensus-eps-surprise-chart | Silgan Holdings Inc. Quote
Costs and Margins
In first-quarter 2024, the cost of goods sold decreased 7% year over year to $1.09 billion. The gross profit decreased 6.1% to $223.5 million. The gross margin was 17% compared with the prior-year quarter’s 16.8%.
Selling, general and administrative expenses were $100.5 million, flat year over year. The company reported an adjusted operating income of $135.5 million compared with $149.4 million in the prior-year quarter. The operating margin was 10.3% compared with the prior-year quarter’s 10.5%.
Segment Performances
Revenues in the Dispensing and Specialty Closures segment were down 7.6% year over year to $536 million. Results were impacted by a lower volume mix, driven by double-digit declines in higher volume closures for food and beverage markets owing to customer destocking. Demand for global dispensing products, however, remained strong. The adjusted operating income for the segment was $78 million compared with $83 million in first-quarter 2023.
The Metal Containers segment’s revenues declined 8% year over year to $617 million due to lower volumes attributed to continued customer destocking across several categories. The segment’s adjusted operating income was $45 million, a 14% decline from the prior-year quarter’s $52 million.
In the Custom Containers segment, revenues were $164 million compared with the year-ago quarter’s $168 million. Lower volumes due to customer destocking impacted revenues. The segment reported an adjusted operating income of $20.2 million, up marginally from the previous year's quarter’s $ 20 million.
Cash Flow & Cash Position
The company had cash and cash equivalents of $309 million at the end of the first quarter of 2024 compared with $643 million at the end of 2023. SLGN used $548 million of cash in operating activities compared with an outflow of $632 million in the first quarter of 2023.
2024 Outlook
Silgan expects 2024 adjusted EPS between $3.55 and $3.75. Volumes in all segments are expected to improve from 2023 levels. The company had reported an adjusted EPS of $3.40 for 2023.
Silgan has been progressing on a $50 million cost reduction program and expects to deliver $20 million of cost savings in 2024.
For second-quarter 2024, SLGN anticipates adjusted EPS in the range of 82 cents to 92 cents. The company expects proving demand trends to reflect in the quarter’s results. It had reported an adjusted EPS of 83 cents for the second quarter of 2023.
Price Performance
Silgan’s shares have lost 1.9% in the past year against the industry’s 9.3% growth.
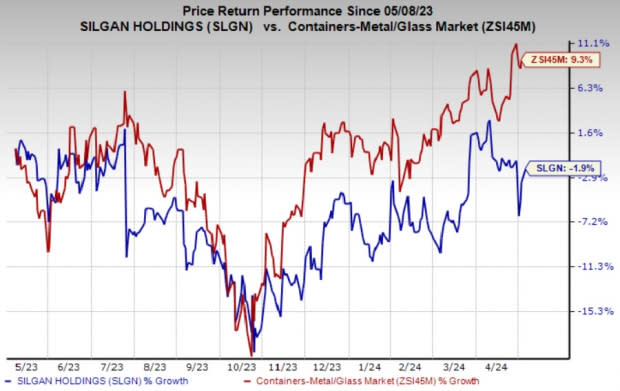
Image Source: Zacks Investment Research
Zacks Rank
SLGN currently carries a Zacks Rank #3 (Hold). You can see the complete list of today’s Zacks #1 Rank (Strong Buy) stocks here.
How Did SLGN’s Industry Peers Fare in Q1?
Amcor Plc AMCR reported third-quarter fiscal 2024 (ended Mar 31, 2024) adjusted EPS of approximately 18 cents, which beat the Zacks Consensus Estimate of 17 cents. This represents a 1.7% increase from the year-ago quarter, primarily attributed to the realization of benefits from structural cost initiatives. AMCR has also delivered a turnaround performance from the four consecutive quarters of decline in earnings.
Amcor’s total revenues fell 7% year over year to $3.4 billion. The top line missed the Zacks Consensus Estimate of $3.53 billion. The price/mix had an unfavorable impact of around 3% on sales. Volume was down 4% from the year-ago quarter owing to weak demand in healthcare categories and the North America beverage business.
AptarGroup, Inc. ATR reported first-quarter 2024 adjusted EPS of $1.26, beating the Zacks Consensus Estimate of $1.13. The bottom line increased 31% from 95 cents (including comparable exchange rates) per share in the year-ago quarter aided by strong sales growth in the Pharma business and continued margin expansion in the Beauty and Closures businesses.
AptarGroup’s total revenues increased 6.4% year over year to $915 million, surpassing the consensus estimate of $897 million. Core sales, excluding currency and acquisition effects, improved 5% year over year.
Sealed Air Corporation SEE reported first-quarter 2024 adjusted EPS of 78 cents, which surpassed the Zacks Consensus Estimate of 53 cents. The bottom line increased 5% year over year.
Sealed Air’s total revenues were $1.33 billion, which beat the consensus estimate of $1.28 billion. The figure was down 1.4% from $1.35 billion in the first quarter of 2023.
Want the latest recommendations from Zacks Investment Research? Today, you can download 7 Best Stocks for the Next 30 Days. Click to get this free report
Silgan Holdings Inc. (SLGN) : Free Stock Analysis Report
Sealed Air Corporation (SEE) : Free Stock Analysis Report
AptarGroup, Inc. (ATR) : Free Stock Analysis Report
Amcor PLC (AMCR) : Free Stock Analysis Report
