
 Yahoo Finance
 Was SIIC Environment Holdings Ltd’s (SGX:BHK) Earnings Growth Better Than The Industry’s?

In this commentary, I will examine SIIC Environment Holdings Ltd’s (SGX:BHK) latest earnings update (31 March 2018) and compare these figures against its performance over the past couple of years, as well as how the rest of the water utilities industry performed. As an investor, I find it beneficial to assess BHK’s trend over the short-to-medium term in order to gauge whether or not the company is able to meet its goals, and ultimately sustainably grow over time. See our latest analysis for SIIC Environment Holdings
Could BHK beat the long-term trend and outperform its industry?
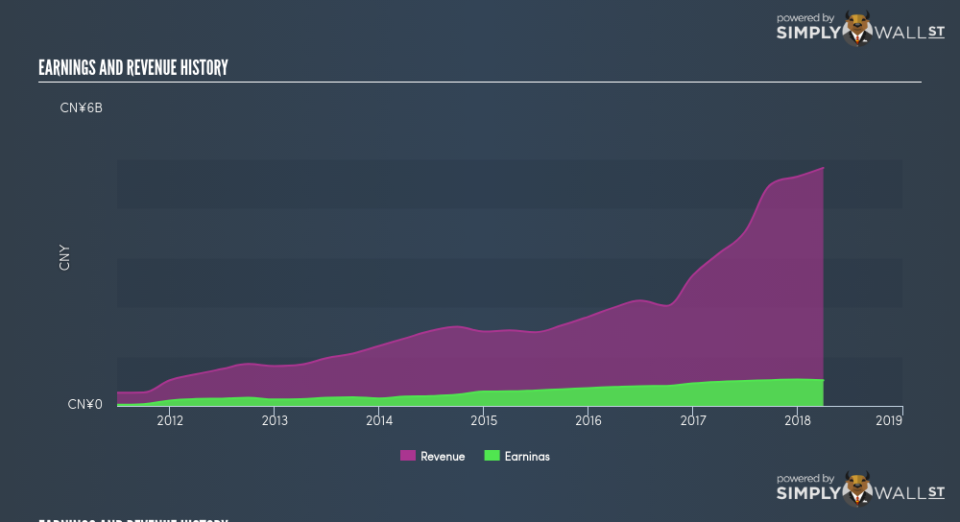
BHK’s trailing twelve-month earnings (from 31 March 2018) of S$517.40m has increased by 6.55% compared to the previous year. However, this one-year growth rate has been lower than its average earnings growth rate over the past 5 years of 26.82%, indicating the rate at which BHK is growing has slowed down. To understand what’s happening, let’s take a look at what’s transpiring with margins and whether the whole industry is feeling the heat.
Revenue growth in the last few years, has been positive, however, earnings growth has been lagging behind meaning SIIC Environment Holdings has been ramping up its expenses by a lot more. This harms margins and earnings, and is not a sustainable practice. Viewing growth from a sector-level, the SG water utilities industry has been growing its average earnings by double-digit 15.19% over the previous twelve months, and 12.09% over the past five years. This means any uplift the industry is benefiting from, SIIC Environment Holdings has not been able to reap as much as its average peer.
In terms of returns from investment, SIIC Environment Holdings has not invested its equity funds well, leading to a 6.45% return on equity (ROE), below the sensible minimum of 20%. Furthermore, its return on assets (ROA) of 3.79% is below the SG Water Utilities industry of 4.69%, indicating SIIC Environment Holdings’s are utilized less efficiently. And finally, its return on capital (ROC), which also accounts for SIIC Environment Holdings’s debt level, has declined over the past 3 years from 6.34% to 3.71%.
What does this mean?
Though SIIC Environment Holdings’s past data is helpful, it is only one aspect of my investment thesis. Companies that have performed well in the past, such as SIIC Environment Holdings gives investors conviction. However, the next step would be to assess whether the future looks as optimistic. You should continue to research SIIC Environment Holdings to get a better picture of the stock by looking at:
Future Outlook: What are well-informed industry analysts predicting for BHK’s future growth? Take a look at our free research report of analyst consensus for BHK’s outlook.
Financial Health: Is BHK’s operations financially sustainable? Balance sheets can be hard to analyze, which is why we’ve done it for you. Check out our financial health checks here.
Other High-Performing Stocks: Are there other stocks that provide better prospects with proven track records? Explore our free list of these great stocks here.
NB: Figures in this article are calculated using data from the trailing twelve months from 31 March 2018. This may not be consistent with full year annual report figures.
To help readers see pass the short term volatility of the financial market, we aim to bring you a long-term focused research analysis purely driven by fundamental data. Note that our analysis does not factor in the latest price sensitive company announcements.
The author is an independent contributor and at the time of publication had no position in the stocks mentioned.
