
 Yahoo Finance
 Siam Cement PCL's Dividend Analysis
Assessing the Dividend Performance and Sustainability of Siam Cement PCL
Siam Cement PCL (SCVPF) recently announced a dividend of $3.5 per share, payable on 2024-04-23, with the ex-dividend date set for 2024-04-04. As investors look forward to this upcoming payment, the spotlight also shines on the company's dividend history, yield, and growth rates. Using the data from GuruFocus, let's look into Siam Cement PCL's dividend performance and assess its sustainability.
What Does Siam Cement PCL Do?
This Powerful Chart Made Peter Lynch 29% A Year For 13 Years
How to calculate the intrinsic value of a stock?
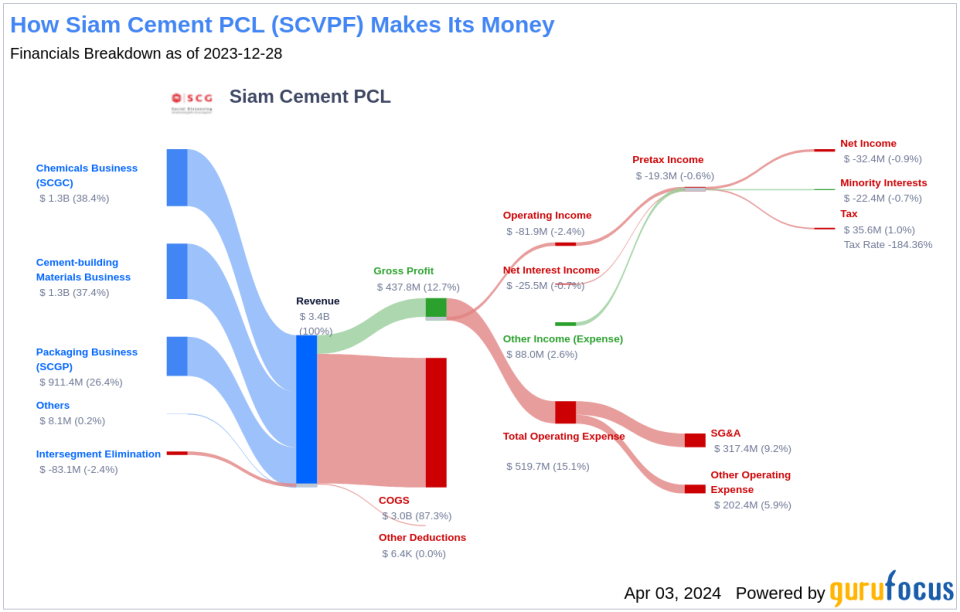
Siam Cement PCL is a holding company which manufactures and sells a variety of building materials, chemicals, and packaging products. The company organizes itself into four segments based on product type. The chemicals segment, which generates more revenue than any other segment, sells olefins and polyolefins. The cement-building materials segment sells cement, ready-mix concrete, roof tiles, ceramic tiles, and sanitary products. The packaging segment sells pulp, printing and writing paper, and corrugated paper used for packaging. The majority of revenue comes from Thailand.
A Glimpse at Siam Cement PCL's Dividend History
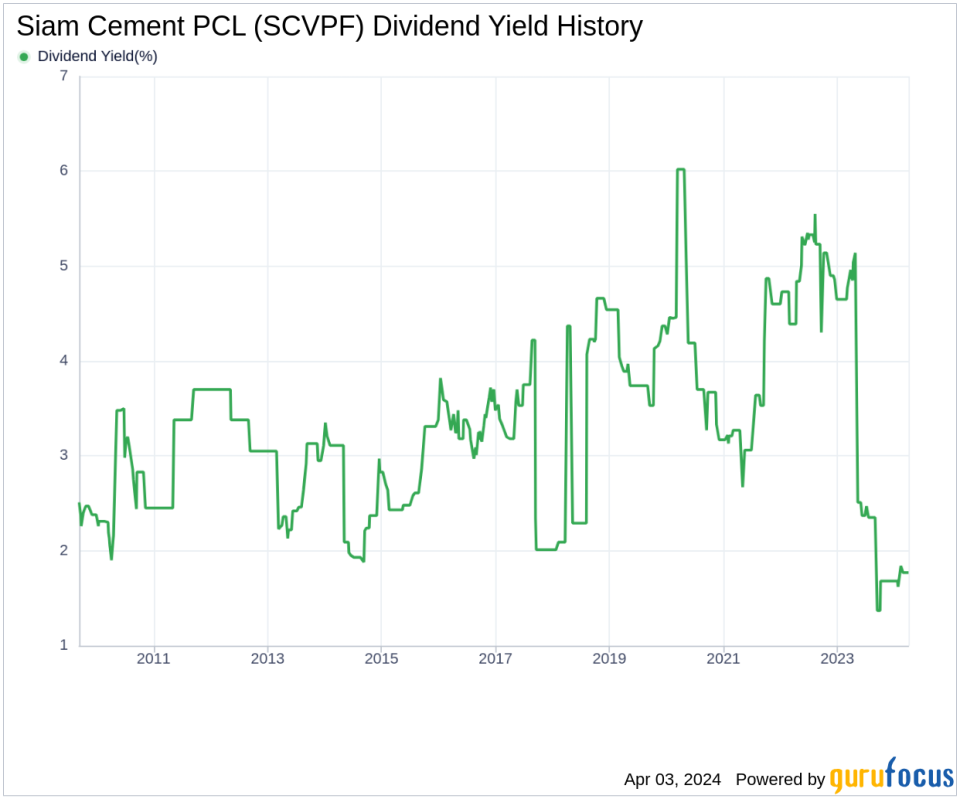
Siam Cement PCL has maintained a consistent dividend payment record since 2009. Dividends are currently distributed on a bi-annual basis. Below is a chart showing annual Dividends Per Share for tracking historical trends.
Breaking Down Siam Cement PCL's Dividend Yield and Growth
As of today, Siam Cement PCL currently has a 12-month trailing dividend yield of 1.77% and a 12-month forward dividend yield of 2.68%. This suggests an expectation of increased dividend payments over the next 12 months. Over the past three years, Siam Cement PCL's annual dividend growth rate was -28.90%. Extended to a five-year horizon, this rate increased to -18.10% per year. And over the past decade, Siam Cement PCL's annual dividends per share growth rate stands at -4.70%.
Based on Siam Cement PCL's dividend yield and five-year growth rate, the 5-year yield on cost of Siam Cement PCL stock as of today is approximately 0.65%.
The Sustainability Question: Payout Ratio and Profitability
To assess the sustainability of the dividend, one needs to evaluate the company's payout ratio. The dividend payout ratio provides insights into the portion of earnings the company distributes as dividends. A lower ratio suggests that the company retains a significant part of its earnings, thereby ensuring the availability of funds for future growth and unexpected downturns. As of 2023-12-31, Siam Cement PCL's dividend payout ratio is 0.21.
Siam Cement PCL's profitability rank, offers an understanding of the company's earnings prowess relative to its peers. GuruFocus ranks Siam Cement PCL's profitability 7 out of 10 as of 2023-12-31, suggesting good profitability prospects. The company has reported positive net income for each of year over the past decade, further solidifying its high profitability.
Growth Metrics: The Future Outlook
To ensure the sustainability of dividends, a company must have robust growth metrics. Siam Cement PCL's growth rank of 7 out of 10 suggests that the company's growth trajectory is good relative to its competitors. Revenue is the lifeblood of any company, and Siam Cement PCL's revenue per share, combined with the 3-year revenue growth rate, indicates a strong revenue model. Siam Cement PCL's revenue has increased by approximately 7.70% per year on average, a rate that outperforms approximately 53.46% of global competitors.
The company's 3-year EPS growth rate showcases its capability to grow its earnings, a critical component for sustaining dividends in the long run. During the past three years, Siam Cement PCL's earnings increased by approximately -12.00% per year on average, a rate that outperforms approximately 16.09% of global competitors.
Lastly, the company's 5-year EBITDA growth rate of -11.60%, which outperforms approximately 11.2% of global competitors.
Next Steps
In conclusion, Siam Cement PCL's upcoming dividend, along with its historical payments, reflect a pattern of commitment to shareholder returns. Despite a decline in the dividend growth rate over the years, the company's low payout ratio and solid profitability rank suggest that dividends are well-supported by earnings. Looking at the growth metrics, Siam Cement PCL demonstrates a strong revenue model with a good growth rank, though its earnings and EBITDA growth rates indicate areas for improvement. For investors seeking dividend-paying stocks, Siam Cement PCL presents a mix of stability and potential, backed by a consistent dividend policy and a robust business model. As the company navigates the future, will it be able to enhance its growth metrics and thereby secure and possibly increase its dividend payments? For further insights and investment opportunities, GuruFocus Premium users can screen for high-dividend yield stocks using the High Dividend Yield Screener.
This article, generated by GuruFocus, is designed to provide general insights and is not tailored financial advice. Our commentary is rooted in historical data and analyst projections, utilizing an impartial methodology, and is not intended to serve as specific investment guidance. It does not formulate a recommendation to purchase or divest any stock and does not consider individual investment objectives or financial circumstances. Our objective is to deliver long-term, fundamental data-driven analysis. Be aware that our analysis might not incorporate the most recent, price-sensitive company announcements or qualitative information. GuruFocus holds no position in the stocks mentioned herein.
This article first appeared on GuruFocus.
