
 Yahoo Finance
SI Research: UMS Holdings – Will History Repeat Itself?
The share price of semiconductor equipment manufacturer, UMS Holdings (UMS), fell more than 3.4 percent to $1.12 on 14 August 2017 despite a stellar 1H17 result reporting a net profit that more than doubled for the period.
The sharp fall for no apparent reason has bewildered many, with some investors pointing the finger at the group’s proposed one-for-four bonus issue that came along with the results release. Management had explained that the rationale for the bonus issue is to increase the issued share capital base of the company to reflect the growth and expansion of the group’s business, thereby enhancing greater trading liquidity.
One would have recalled that the last time UMS issued bonus shares way back in June 2014, its share price also suffered a similar fate plummeting 42.5 percent from a high of $0.73 to a low of $0.42 within a short time span of merely three months. The plunge then was largely a result of substantial shareholder Applied Materials and chief executive officer Mr Andy Luong liquidating portions of their stakes prior to the bonus issue despite UMS booking strong financial performances.
Now, UMS’s share price has broken below the $1 support on 18 August 2017 along with the correction. With the last market price of $0.955 as at 25 August 2017, this implies a retracement of 14.7 percent which is still a far cry in comparison to the decline in June 2014. Shareholders are worried if history would repeat itself again this time round overshadowed by UMS’s “bonus issue curse”. This issue, we shall seek to understand a bit more about this company and see if investors’ worries are justified.
Business Profile
UMS’s core business is in the provision of equipment manufacturing and engineering services to original equipment manufacturers of semiconductors, and has production facilities in Singapore, Malaysia as well as California and Texas in the US. Geographically, the main bulk of its FY16 revenue is derived from Singapore at 64.5 percent, US and Malaysia at 10.3 percent and 1.9 percent respectively, while the rest came from other countries including China, Poland, Taiwan and South Korea.
It is notable that approximately 87 percent of the group’s FY16 revenue from its semiconductor segments was attributable to sales from its largest customer, widely believed to be Applied Materials, a leader in chip manufacturing and advanced display. Applied Materials’ latest 3Q17 results turned out to be the best quarter in its 50-year history generating record revenue of US$3.7 billion. With its major customer doing well having revenue and profits at all-time highs, it is not surprising then that UMS could also deliver robust performances in recent quarters.
Record Year In Sight
UMS’s revenues throughout the last five years were relatively stable albeit rather flat hovering at just above the $100 million level. Net profit grew modestly at a compounded annual growth rate of 7.4 percent to $22.6 million from $17 million five years ago.
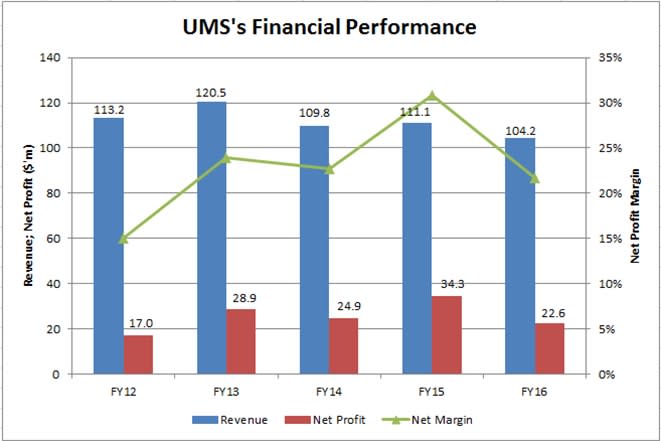
Source: Company Annual Reports
Nevertheless, things started to turn for the better since late last year. UMS experienced a pickup in its orders amidst strong growth in the global semiconductor equipment industry while chip makers quickened the pace with their capital expenditure programs.
For 1H17, revenue soared by 92.2 percent to $84.5 million with both the group’s core business segments reporting positive growth arising from high demand. Likewise, net profit more than doubled to $22.7 million underpinned by the group’s healthy sales growth. We believe that the exceptional financial performances of UMS played a large part in propelling its share price to a record high of $1.25 in May this year.
With its 1H17 revenue coming in at 81.1 percent of FY16 revenue and net profit already surpassing that in FY16, we would expect UMS to be on track to deliver a record year barring any unforeseen circumstances.
Dividends Sustainable By Free Cash Flow
At first glance, UMS’s high dividends seem unsustainable judging from the fact that the group is paying out $25.7 million of dividends from its net profit of $22.6 million in FY16, resulting in a payout ratio (from net profit) of more than 1.1 times. However, because many of the expenses recorded in the income statement (such as depreciation expense, impairment of goodwill and allowance for inventories obsolescence) were non-cash in nature, this leads to UMS having a free cash flow of $31.2 million. If we were to look at dividend payout from the group’s free cash flow, the payout ratio (from free cash flow) of 0.8 times would look much more manageable.
Despite a relatively high dividend yield, UMS’s payout ratio from its free cash flow has never exceeded the 90 percent mark in the last five years, maintaining in the healthy region between 60 and 90 percent. Hence, we reckon that UMS’s dividends should be sustainable if the group can continue to keep up or grow its top line and cash flow.
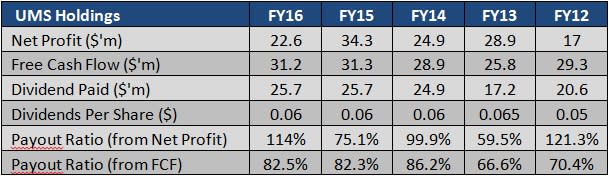
Source: Company Annual Reports
Rich Valuation
As at 25 August 2017, UMS’s market price of $0.955 entailed a remarkable year-to-date return of 58.2 percent for shareholders just from price appreciation alone without taking into account the dividends received. Current price implies a price-to-earnings (P/E) ratio of 11.6 times and a price-to-book (P/B) ratio of 2.1 times.
From UMS’s historical P/E and P/B charts, we can see that the group’s current P/E and P/B ratio appear somewhat inflated at above their one standard deviation and two standard deviations levels respectively. We think UMS’s strong profitability growth has already been priced in by the phenomenal rally since early this year, and current rich valuations are at best fair and not exactly cheap in our opinion.
Despite the recent correction owing to bonus issue and profit taking, we are of the opinion that this does not present an opportunity for bargain yet considering the expensive valuations, as well as the unattractive yield of 6.3 percent now which has slipped significantly from the double-digit yield just a couple of years back.
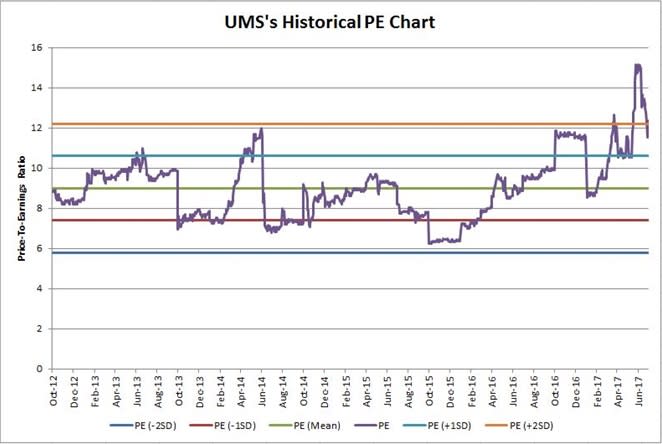
Source: Author’s Compilation
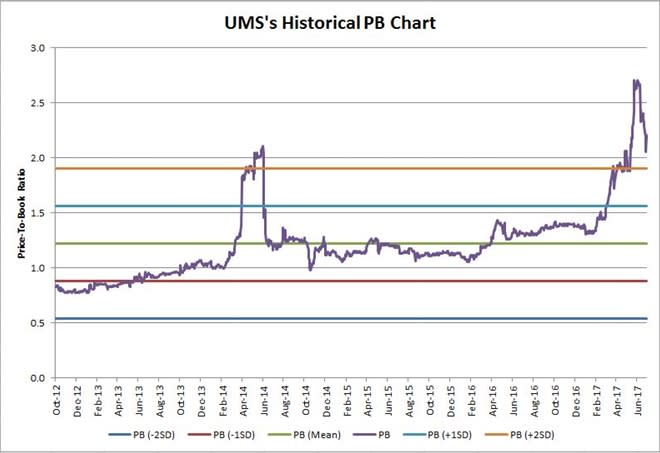
Source: Author’s Compilation