
 Yahoo Finance
SI Research: 3 Red Flags Of Hi-P International
Gone were the days when leading integrated contract manufacturer Hi-P International (Hi-P) was trading at the region above $2.50 a share during the first quarter of this year. Within a short time span of slightly more than six months, the share price of this tooling specialist has tumbled by more than 72.1 percent from an all-time high of $2.72 to $0.76 as at 29 October 2018. In line with the heightening negative sentiments around this counter, we point out three red flags with regard to Hi-P’s financials which could be precursors to the group’s deteriorating performances amidst challenging operating environment.
Declining Profitability
Back in FY17, Hi-P boasted a record level of revenue driven by strengthening of global demand helped by improving macroeconomic fundamentals. Over the last five years, the group’s top line expanded at a compounded annual growth rate (CAGR) of 3.1 percent from $1.3 billion in FY13 to more than $1.4 billion in FY17. Correspondingly, gross profit surged by 49.4 percent year-on-year to $232.9 million in FY17, while increasing at a CAGR of 24.3 percent over the last five years. Likewise, net profit more than doubled in FY17 to $121.5 million as it compounded exponentially by more than 108 percent per annum in the last five years.
Unfortunately, Hi-P’s strong momentum of growth halted abruptly beginning this year. While 1H18 revenue rose 11.3 percent to $583.1 million attributable to higher sales volume, gross profit dipped 0.2 percent to $67.5 million because of more competitive pricing and a change in product mix. Together with higher finance costs and other expenses arising from foreign exchange loss and loss from the liquidation of a subsidiary, net profit sank 4.8 percent to $22.4 million.
It is noteworthy that Hi-P’s margins are currently under pressure given its large operating fixed cost coupled with an environment of fierce pricing competition. Gross profit margin standing at 11.6 percent as at 1H18 had worsened significantly from 16.3 percent recorded in FY17. As the demand outlook weakens, deteriorating manufacturing yield could hit Hi-P much harder than we expected.
Even before the release of the 3Q18 results slated on 8 November 2018, management has already guided for lower revenue and profit for the coming quarter owing to delay in sales of certain production tools, lower manufacturing yield and lower market demand for certain products. To be exact, this would be the second time Hi-P had lowered its earnings guidance this year.
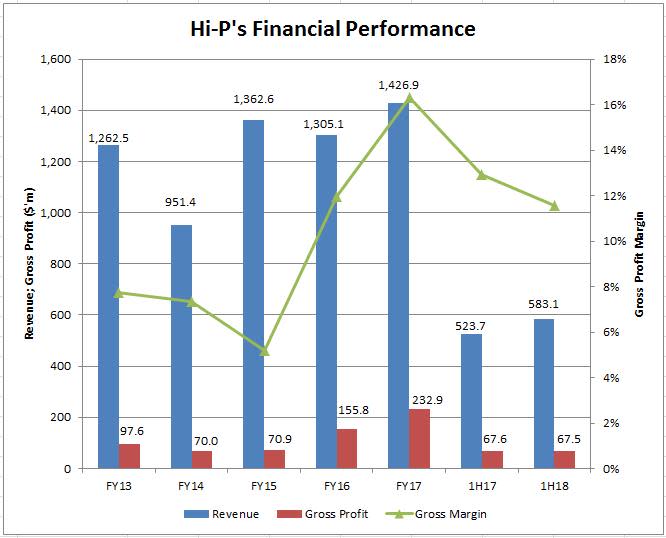
Source: Company’s Annual Reports
Lower Net Cash
Hi-P recorded cash and cash equivalents and restricted bank deposits of $282.8 million as at 31 December 2017, as well as $205.2 million of current and non-current loans and borrowings. In 1H18, the figures stood at $257.8 million and $195.4 million respectively. In essence, this translated to a lower net cash position from $77.6 million in FY17 to $62.4 million in 1H18 largely due to reduced cash holdings following the payment of dividends and repayment of loans during the period.
In addition, the fact that inventories had risen 3.5 percent to $184.8 million as at 30 June 2018 is also another worrying factor in that this could raise the risks of obsolete inventories being written off and increased inventory provisions.
Straining Cash Flows
Hi-P used up $14.6 million of cash in operating activities for 2Q18 after working capital changes, as compared to $51.5 million of operating cash flow being generated in the correspondingly quarter last year. Together with the payments made for the purchase of capital expenditure as well as net repayment of loans and payment of dividends, total reduction in cash equivalents during that quarter amounted to $112.7 million.
Hi-P has 13 manufacturing plants globally located across six locations in China, Poland, Singapore and Thailand. Hence, we would expect the group to be vulnerable to the trade tariffs implemented on imported Chinese goods. In light of the easing market demand and weakening manufacturing yield, we would prefer to see stronger recovery in Hi-P’s profitability before turning more positive on its stocks.