
 Yahoo Finance
 Sheng Siong Group (SGX:OV8) Has Announced That It Will Be Increasing Its Dividend To SGD0.032
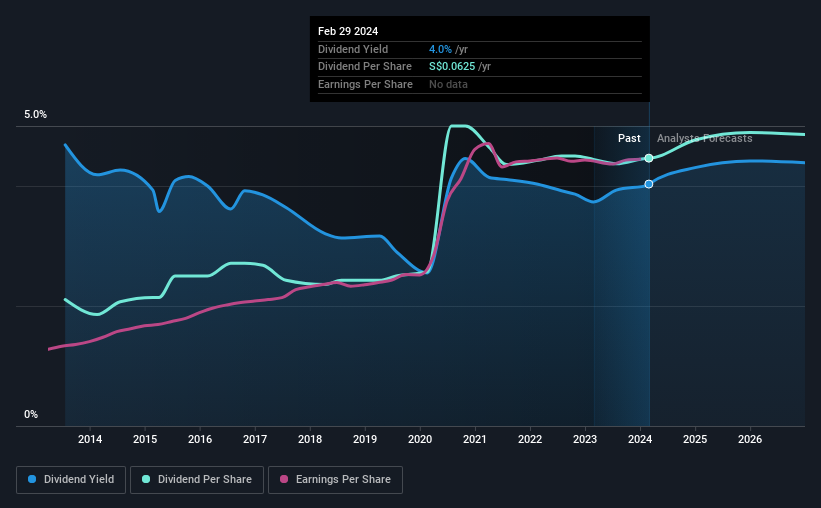
Sheng Siong Group Ltd (SGX:OV8) has announced that it will be increasing its periodic dividend on the 17th of May to SGD0.032, which will be 4.2% higher than last year's comparable payment amount of SGD0.0307. Based on this payment, the dividend yield for the company will be 4.0%, which is fairly typical for the industry.
Check out our latest analysis for Sheng Siong Group
Sheng Siong Group's Payment Has Solid Earnings Coverage
While it is always good to see a solid dividend yield, we should also consider whether the payment is feasible. Before this announcement, Sheng Siong Group was paying out 70% of earnings, but a comparatively small 54% of free cash flows. Since the dividend is just paying out cash to shareholders, we care more about the cash payout ratio from which we can see plenty is being left over for reinvestment in the business.
Looking forward, earnings per share is forecast to rise by 9.2% over the next year. If the dividend continues along recent trends, we estimate the payout ratio will be 70%, which is in the range that makes us comfortable with the sustainability of the dividend.
Dividend Volatility
The company has a long dividend track record, but it doesn't look great with cuts in the past. The annual payment during the last 10 years was SGD0.0295 in 2014, and the most recent fiscal year payment was SGD0.0625. This works out to be a compound annual growth rate (CAGR) of approximately 7.8% a year over that time. A reasonable rate of dividend growth is good to see, but we're wary that the dividend history is not as solid as we'd like, having been cut at least once.
The Dividend Looks Likely To Grow
With a relatively unstable dividend, it's even more important to see if earnings per share is growing. We are encouraged to see that Sheng Siong Group has grown earnings per share at 14% per year over the past five years. EPS has been growing at a reasonable rate, although with most of the profits being paid out to shareholders, growth prospects could be more limited in the future.
We Really Like Sheng Siong Group's Dividend
In summary, it is always positive to see the dividend being increased, and we are particularly pleased with its overall sustainability. The company is easily earning enough to cover its dividend payments and it is great to see that these earnings are being translated into cash flow. All of these factors considered, we think this has solid potential as a dividend stock.
Investors generally tend to favour companies with a consistent, stable dividend policy as opposed to those operating an irregular one. Still, investors need to consider a host of other factors, apart from dividend payments, when analysing a company. For example, we've picked out 1 warning sign for Sheng Siong Group that investors should know about before committing capital to this stock. Looking for more high-yielding dividend ideas? Try our collection of strong dividend payers.
Have feedback on this article? Concerned about the content? Get in touch with us directly. Alternatively, email editorial-team (at) simplywallst.com.
This article by Simply Wall St is general in nature. We provide commentary based on historical data and analyst forecasts only using an unbiased methodology and our articles are not intended to be financial advice. It does not constitute a recommendation to buy or sell any stock, and does not take account of your objectives, or your financial situation. We aim to bring you long-term focused analysis driven by fundamental data. Note that our analysis may not factor in the latest price-sensitive company announcements or qualitative material. Simply Wall St has no position in any stocks mentioned.
