
 Yahoo Finance
 Shareholders in SIA Engineering (SGX:S59) are in the red if they invested five years ago
Ideally, your overall portfolio should beat the market average. A talented investor can beat the market with a diversified portfolio, but even then, some stocks will under-perform. While the SIA Engineering Company Limited (SGX:S59) share price is down 10% over half a decade, the total return to shareholders (which includes dividends) was -1.2%. That's better than the market which declined 5.4% over the same time.
So let's have a look and see if the longer term performance of the company has been in line with the underlying business' progress.
View our latest analysis for SIA Engineering
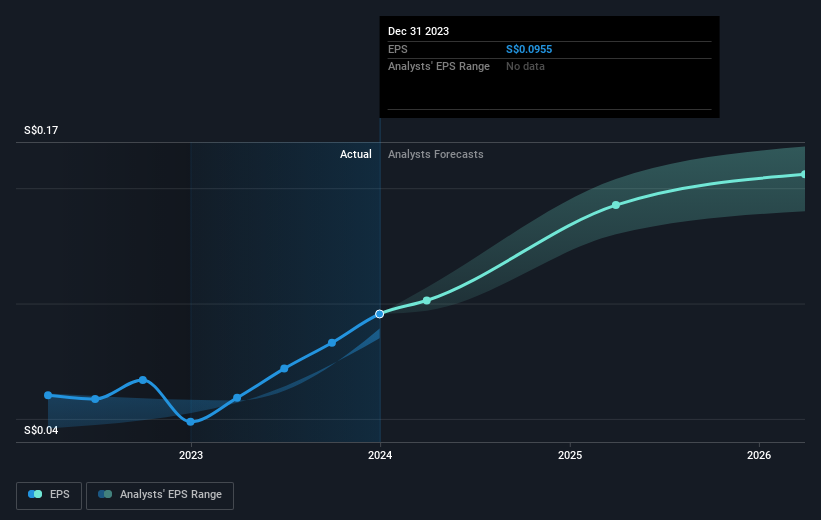
While the efficient markets hypothesis continues to be taught by some, it has been proven that markets are over-reactive dynamic systems, and investors are not always rational. One flawed but reasonable way to assess how sentiment around a company has changed is to compare the earnings per share (EPS) with the share price.
Looking back five years, both SIA Engineering's share price and EPS declined; the latter at a rate of 8.6% per year. The share price decline of 2% per year isn't as bad as the EPS decline. The relatively muted share price reaction might be because the market expects the business to turn around.
The graphic below depicts how EPS has changed over time (unveil the exact values by clicking on the image).
We know that SIA Engineering has improved its bottom line over the last three years, but what does the future have in store? You can see how its balance sheet has strengthened (or weakened) over time in this free interactive graphic.
What About Dividends?
It is important to consider the total shareholder return, as well as the share price return, for any given stock. Whereas the share price return only reflects the change in the share price, the TSR includes the value of dividends (assuming they were reinvested) and the benefit of any discounted capital raising or spin-off. Arguably, the TSR gives a more comprehensive picture of the return generated by a stock. As it happens, SIA Engineering's TSR for the last 5 years was -1.2%, which exceeds the share price return mentioned earlier. The dividends paid by the company have thusly boosted the total shareholder return.
A Different Perspective
It's good to see that SIA Engineering has rewarded shareholders with a total shareholder return of 1.4% in the last twelve months. And that does include the dividend. There's no doubt those recent returns are much better than the TSR loss of 0.2% per year over five years. This makes us a little wary, but the business might have turned around its fortunes. Before deciding if you like the current share price, check how SIA Engineering scores on these 3 valuation metrics.
If you are like me, then you will not want to miss this free list of growing companies that insiders are buying.
Please note, the market returns quoted in this article reflect the market weighted average returns of stocks that currently trade on Singaporean exchanges.
Have feedback on this article? Concerned about the content? Get in touch with us directly. Alternatively, email editorial-team (at) simplywallst.com.
This article by Simply Wall St is general in nature. We provide commentary based on historical data and analyst forecasts only using an unbiased methodology and our articles are not intended to be financial advice. It does not constitute a recommendation to buy or sell any stock, and does not take account of your objectives, or your financial situation. We aim to bring you long-term focused analysis driven by fundamental data. Note that our analysis may not factor in the latest price-sensitive company announcements or qualitative material. Simply Wall St has no position in any stocks mentioned.
