
 Yahoo Finance
 Shareholders in John Wiley & Sons (NYSE:WLY) are in the red if they invested three years ago
While not a mind-blowing move, it is good to see that the John Wiley & Sons, Inc. (NYSE:WLY) share price has gained 13% in the last three months. But that doesn't help the fact that the three year return is less impressive. Truth be told the share price declined 40% in three years and that return, Dear Reader, falls short of what you could have got from passive investing with an index fund.
It's worthwhile assessing if the company's economics have been moving in lockstep with these underwhelming shareholder returns, or if there is some disparity between the two. So let's do just that.
View our latest analysis for John Wiley & Sons
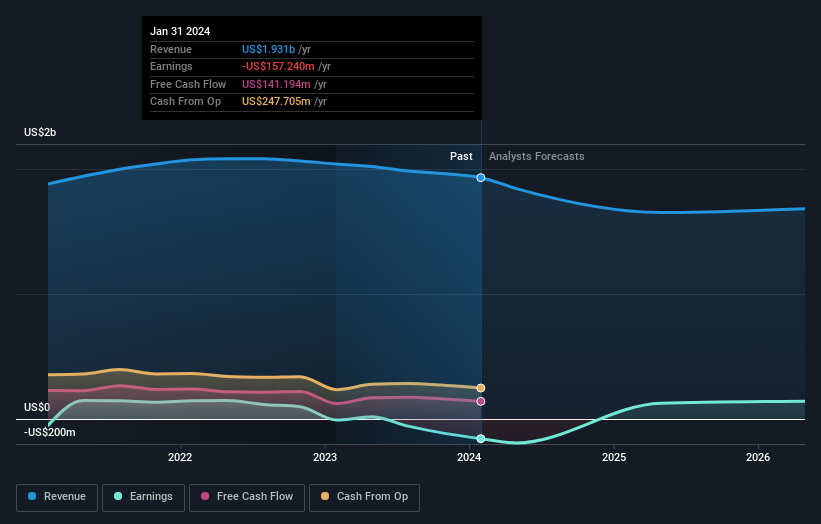
Because John Wiley & Sons made a loss in the last twelve months, we think the market is probably more focussed on revenue and revenue growth, at least for now. Generally speaking, companies without profits are expected to grow revenue every year, and at a good clip. That's because fast revenue growth can be easily extrapolated to forecast profits, often of considerable size.
Over three years, John Wiley & Sons grew revenue at 0.2% per year. Given it's losing money in pursuit of growth, we are not really impressed with that. Indeed, the stock dropped 12% over the last three years. Shareholders will probably be hoping growth picks up soon. But the real upside for shareholders will be if the company can start generating profits.
The company's revenue and earnings (over time) are depicted in the image below (click to see the exact numbers).
We like that insiders have been buying shares in the last twelve months. Even so, future earnings will be far more important to whether current shareholders make money. You can see what analysts are predicting for John Wiley & Sons in this interactive graph of future profit estimates.
What About Dividends?
As well as measuring the share price return, investors should also consider the total shareholder return (TSR). The TSR is a return calculation that accounts for the value of cash dividends (assuming that any dividend received was reinvested) and the calculated value of any discounted capital raisings and spin-offs. It's fair to say that the TSR gives a more complete picture for stocks that pay a dividend. We note that for John Wiley & Sons the TSR over the last 3 years was -34%, which is better than the share price return mentioned above. This is largely a result of its dividend payments!
A Different Perspective
John Wiley & Sons shareholders are up 9.0% for the year (even including dividends). But that return falls short of the market. The silver lining is that the gain was actually better than the average annual return of 1.0% per year over five year. This could indicate that the company is winning over new investors, as it pursues its strategy. I find it very interesting to look at share price over the long term as a proxy for business performance. But to truly gain insight, we need to consider other information, too. To that end, you should learn about the 4 warning signs we've spotted with John Wiley & Sons (including 1 which is significant) .
If you like to buy stocks alongside management, then you might just love this free list of companies. (Hint: most of them are flying under the radar).
Please note, the market returns quoted in this article reflect the market weighted average returns of stocks that currently trade on American exchanges.
Have feedback on this article? Concerned about the content? Get in touch with us directly. Alternatively, email editorial-team (at) simplywallst.com.
This article by Simply Wall St is general in nature. We provide commentary based on historical data and analyst forecasts only using an unbiased methodology and our articles are not intended to be financial advice. It does not constitute a recommendation to buy or sell any stock, and does not take account of your objectives, or your financial situation. We aim to bring you long-term focused analysis driven by fundamental data. Note that our analysis may not factor in the latest price-sensitive company announcements or qualitative material. Simply Wall St has no position in any stocks mentioned.
