
 Yahoo Finance
 ServiceNow (NOW) Q1 Earnings Beat Estimates, Revenues Up Y/Y
ServiceNow NOW reported first-quarter 2024 adjusted earnings of $3.41 per share, which beat the Zacks Consensus Estimate by 8.25% and jumped 44% year over year.
Revenues of $2.60 billion beat the consensus mark by 0.62% and increased 24.2% year over year. At constant currency (cc), revenues increased 24% year over year to $2.597 billion.
Subscription revenues improved 24.7% year over year to $2.52 billion. At cc, subscription revenues increased 24.5% year over year, 50 basis points (bps) above the high end of the company’s guidance.
Professional services and other revenues increased 11% year over year, both on a reported and cc basis to $80 million.
At the end of the first quarter, the current remaining performance obligations (cRPO) were $8.45 billion, up 21% year over year, both on a reported and cc basis and 100 bps higher than management’s guidance. Remaining performance obligations, on a constant currency basis, rose 27% year over year to $17.7 billion.
ServiceNow, Inc. Price, Consensus and EPS Surprise
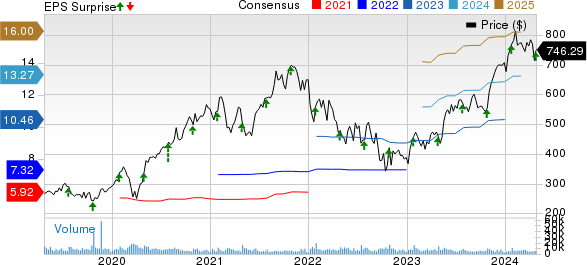
ServiceNow, Inc. price-consensus-eps-surprise-chart | ServiceNow, Inc. Quote
ServiceNow had 1,933 total customers with more than $1 million in annual contract value (ACV) at the end of the reported quarter, which represents 15.5% year-over-year growth in customers.
In the reported quarter, ServiceNow had eight deals greater than $5 million in net new ACV, and four deals of more than $10 million. It closed 59 deals greater than $1 million net new ACV. Number of customers contributing more than $20 million or more grew 50% year over year.
In terms of key businesses, ITSM and ITOM were each in 16 of the top 20 deals. On a combined basis, security and risk were 11 of the top 20, while customer creator and employee workflows were in 10 of the top 20 deals.
Generative AI deals continued to gain traction with record-breaking net new ACV for Pro Plus, making it the fastest-selling product in ServiceNow’s history. Gen AI products were in seven of ServiceNow’s top 10 deals, and it closed seven deals worth more than $1 million in ACV in the reported quarter.
Industry-wise, technology, media and telecom net new ACV jumped more than 100% year over year. Education grew nearly 50% year over year, while transportation and logistics, business and consumer services and retail and hospitality also witnessed strong growth.
Operating Details
In the first quarter, the non-GAAP gross margin was 83.5%, up 70 bps on a year-over-year basis.
Subscription gross margin was 85.7%, unchanged year over year. Professional services and other gross margins were 16.3% compared with 2.8% reported in the year-ago quarter.
Total operating expenses were $1.75 billion in the reported quarter, up 15.7% year over year. As a percentage of revenues, operating expenses decreased 500 bps on a year-over-year basis.
ServiceNow’s non-GAAP operating margin expanded 410 bps on a year-over-year basis to 30.4%, 150 bps above management’s guidance, driven by strong top-line growth and disciplined spending.
Balance Sheet & Cash Flow
As of Mar 31, 2024, the company had cash and cash equivalents and short-term investments of $5.11 billion compared with $4.88 billion as of Dec 31, 2023.
During the reported quarter, cash from operations was $1.34 billion compared with $1.61 billion in the previous quarter.
ServiceNow generated a free cash flow of $1.23 billion in the reported quarter, down from $1.34 billion reported in the prior quarter.
The company repurchased 225,000 shares for $175 million and has approximately $787 million remaining in authorization.
Guidance
For second-quarter 2024, subscription revenues are projected between $2.525 billion and $2.53 billion, suggesting an improvement in the range of 21.5-22% year over year on a GAAP basis. At cc, subscription revenues are expected to grow in the 22% range.
cRPO is expected to grow 20.5% year over year on both non-GAAP and GAAP basis.
ServiceNow expects the non-GAAP operating margin to be 25% in the current quarter.
For 2024, the company now expects subscription revenues to be $10.56-$10.575 billion, which suggests a rise between 21.5% and 22% from 2023 on a GAAP basis. At cc, subscription revenues are expected to grow 21.5% over 2023.
ServiceNow expects the non-GAAP subscription gross margin to be 84.5% and the non-GAAP operating margin to be 29%. Moreover, the free cash flow margin is expected to be 31%.
Zacks Rank & Stocks to Consider
Currently, ServiceNow has a Zacks Rank #3 (Hold).
ServiceNow shares have underperformed the Zacks Computer & Technology sector year to date. While NOW shares have gained 5.6%, the Computer & Technology sector has increased 7.6%.
Pinterest PINS, Advanced Micro Devices AMD, and NVIDIA NVDA are some better-ranked stocks that investors can consider in the broader sector. While Pinterest sports a Zacks Rank #1 (Strong Buy) at present, AMD and NVIDIA carry a Zacks Rank #2 (Buy) each. You can see the complete list of today’s Zacks #1 Rank stocks here.
Pinterest shares have declined 11.3% year to date. PINS is set to report its first-quarter 2024 results on Apr 30.
AMD shares have gained 3% year to date. AMD is set to report its first-quarter 2024 results on Apr 30.
NVIDIA shares have gained 58.5% year to date. NVDA is set to report its first-quarter fiscal 2025 results on May 22.
Want the latest recommendations from Zacks Investment Research? Today, you can download 7 Best Stocks for the Next 30 Days. Click to get this free report
Advanced Micro Devices, Inc. (AMD) : Free Stock Analysis Report
NVIDIA Corporation (NVDA) : Free Stock Analysis Report
ServiceNow, Inc. (NOW) : Free Stock Analysis Report
Pinterest, Inc. (PINS) : Free Stock Analysis Report
