
 Yahoo Finance
 Should Sembcorp Industries Ltd’s (SGX:U96) Recent Earnings Decline Worry You?

For investors with a long-term horizon, examining earnings trend over time and against industry peers is more insightful than looking at an earnings announcement in one point in time. Investors may find my commentary, albeit very high-level and brief, on Sembcorp Industries Ltd (SGX:U96) useful as an attempt to give more color around how Sembcorp Industries is currently performing. Check out our latest analysis for Sembcorp Industries
Was U96’s recent earnings decline worse than the long-term trend and the industry?
For the purpose of this commentary, I like to use data from the most recent 12 months, which either annualizes the most recent 6-month earnings update, or in some cases, the most recent annual report is already the latest available financial data. This allows me to analyze different companies on a more comparable basis, using the most relevant data points. For Sembcorp Industries, its most recent earnings (trailing twelve month) is S$146.39M, which, in comparison to the prior year’s figure, has dropped by a significant -59.92%. Since these figures may be relatively nearsighted, I’ve calculated an annualized five-year value for Sembcorp Industries’s net income, which stands at S$626.77M This doesn’t seem to paint a better picture, since earnings seem to have consistently been diminishing over the longer term.
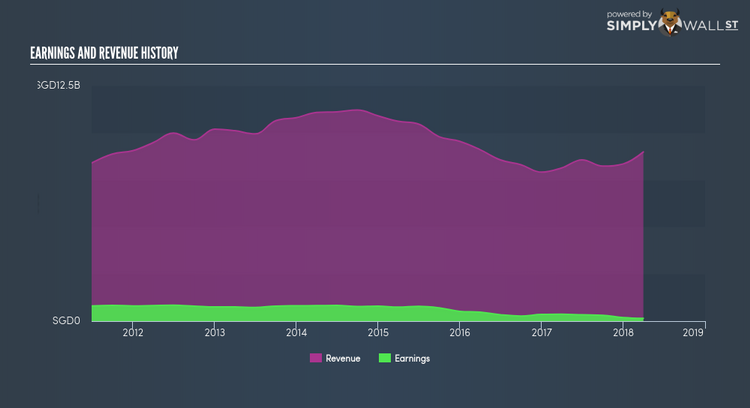
Why could this be happening? Well, let’s take a look at what’s transpiring with margins and if the rest of the industry is feeling the heat. Although revenue growth over the last few years, has been negative, earnings growth has been falling by even more, suggesting that Sembcorp Industries has been ramping up its expenses. This harms margins and earnings, and is not a sustainable practice. Inspecting growth from a sector-level, the SG industrials industry has been growing, albeit, at a muted single-digit rate of 8.52% over the previous year, and 2.99% over the previous five years. This shows that any tailwind the industry is enjoying, Sembcorp Industries has not been able to gain as much as its industry peers.
What does this mean?
Though Sembcorp Industries’s past data is helpful, it is only one aspect of my investment thesis. In some cases, companies that face a drawn out period of reduction in earnings are going through some sort of reinvestment phase with the aim of keeping up with the recent industry disruption and expansion. I suggest you continue to research Sembcorp Industries to get a better picture of the stock by looking at:
Future Outlook: What are well-informed industry analysts predicting for U96’s future growth? Take a look at our free research report of analyst consensus for U96’s outlook.
Financial Health: Is U96’s operations financially sustainable? Balance sheets can be hard to analyze, which is why we’ve done it for you. Check out our financial health checks here.
Other High-Performing Stocks: Are there other stocks that provide better prospects with proven track records? Explore our free list of these great stocks here.
NB: Figures in this article are calculated using data from the trailing twelve months from 31 March 2018. This may not be consistent with full year annual report figures.
To help readers see pass the short term volatility of the financial market, we aim to bring you a long-term focused research analysis purely driven by fundamental data. Note that our analysis does not factor in the latest price sensitive company announcements.
The author is an independent contributor and at the time of publication had no position in the stocks mentioned.
