
 Yahoo Finance
 Is Semapa – Sociedade de Investimento e Gestão SGPS SA (ELI:SEM) A Great Dividend Stock?

Dividends can be underrated but they form a large part of investment returns, playing an important role in compounding returns in the long run. Over the past 10 years, Semapa – Sociedade de Investimento e Gestão SGPS SA (ELI:SEM) has returned an average of 3.00% per year to shareholders in terms of dividend yield. Let’s dig deeper into whether Semapa – Sociedade de Investimento e Gestão SGPS should have a place in your portfolio. See our latest analysis for Semapa – Sociedade de Investimento e Gestão SGPS
Here’s how I find good dividend stocks
When researching a dividend stock, I always follow the following screening criteria:
Does it pay an annual yield higher than 75% of dividend payers?
Has its dividend been stable over the past (i.e. no missed payments or significant payout cuts)?
Has dividend per share amount increased over the past?
Is its earnings sufficient to payout dividend at the current rate?
Will it have the ability to keep paying its dividends going forward?
Does Semapa – Sociedade de Investimento e Gestão SGPS pass our checks?
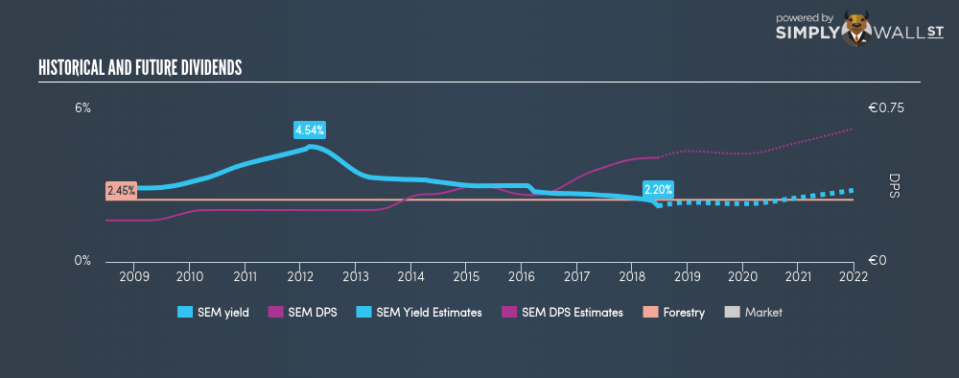
The current trailing twelve-month payout ratio for the stock is 30.16%, meaning the dividend is sufficiently covered by earnings. In the near future, analysts are predicting lower payout ratio of 26.06%, leading to a dividend yield of 2.45%. However, EPS should increase to €1.94, meaning that the lower payout ratio does not necessarily implicate a lower dividend payment.
If there’s one type of stock you want to be reliable, it’s dividend stocks and their stable income-generating ability. SEM has increased its DPS from €0.20 to €0.51 in the past 10 years. It has also been paying out dividend consistently during this time, as you’d expect for a company increasing its dividend levels. These are all positive signs of a great, reliable dividend stock.
In terms of its peers, Semapa – Sociedade de Investimento e Gestão SGPS has a yield of 2.20%, which is on the low-side for Forestry stocks.
Next Steps:
Keeping in mind the dividend characteristics above, Semapa – Sociedade de Investimento e Gestão SGPS is definitely worth considering for investors looking to build a dedicated income portfolio. Given that this is purely a dividend analysis, I recommend taking sufficient time to understand its core business and determine whether the company and its investment properties suit your overall goals. Below, I’ve compiled three important aspects you should further examine:
Future Outlook: What are well-informed industry analysts predicting for SEM’s future growth? Take a look at our free research report of analyst consensus for SEM’s outlook.
Valuation: What is SEM worth today? Even if the stock is a cash cow, it’s not worth an infinite price. The intrinsic value infographic in our free research report helps visualize whether SEM is currently mispriced by the market.
Other Dividend Rockstars: Are there better dividend payers with stronger fundamentals out there? Check out our free list of these great stocks here.
To help readers see pass the short term volatility of the financial market, we aim to bring you a long-term focused research analysis purely driven by fundamental data. Note that our analysis does not factor in the latest price sensitive company announcements.
The author is an independent contributor and at the time of publication had no position in the stocks mentioned.
