
 Yahoo Finance
 Can SeaChange International Inc’s (NASDAQ:SEAC) ROE Continue To Surpass The Industry Average?

This analysis is intended to introduce important early concepts to people who are starting to invest and want to begin learning the link between SeaChange International Inc (NASDAQ:SEAC)’s return fundamentals and stock market performance.
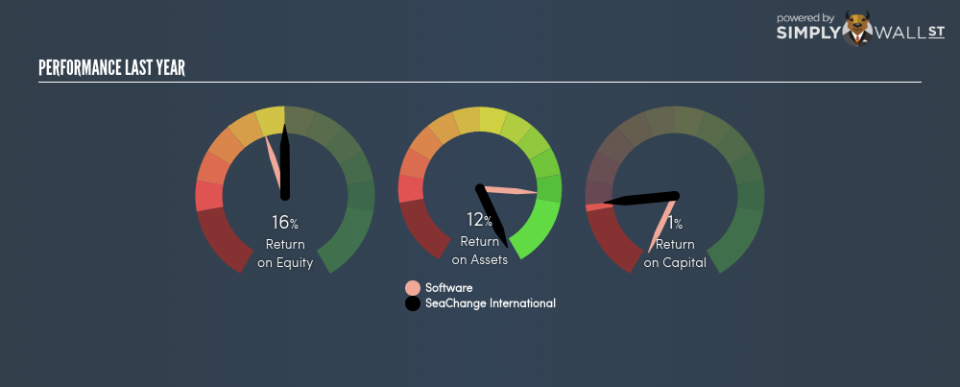
SeaChange International Inc (NASDAQ:SEAC) outperformed the Application Software industry on the basis of its ROE – producing a higher 15.94% relative to the peer average of 13.11% over the past 12 months. While the impressive ratio tells us that SEAC has made significant profits from little equity capital, ROE doesn’t tell us if SEAC has borrowed debt to make this happen. We’ll take a closer look today at factors like financial leverage to determine whether SEAC’s ROE is actually sustainable. See our latest analysis for SeaChange International
Peeling the layers of ROE – trisecting a company’s profitability
Return on Equity (ROE) weighs SeaChange International’s profit against the level of its shareholders’ equity. An ROE of 15.94% implies $0.16 returned on every $1 invested. While a higher ROE is preferred in most cases, there are several other factors we should consider before drawing any conclusions.
Return on Equity = Net Profit ÷ Shareholders Equity
ROE is assessed against cost of equity, which is measured using the Capital Asset Pricing Model (CAPM) – but let’s not dive into the details of that today. For now, let’s just look at the cost of equity number for SeaChange International, which is 9.47%. This means SeaChange International returns enough to cover its own cost of equity, with a buffer of 6.47%. This sustainable practice implies that the company pays less for its capital than what it generates in return. ROE can be dissected into three distinct ratios: net profit margin, asset turnover, and financial leverage. This is called the Dupont Formula:
Dupont Formula
ROE = profit margin × asset turnover × financial leverage
ROE = (annual net profit ÷ sales) × (sales ÷ assets) × (assets ÷ shareholders’ equity)
ROE = annual net profit ÷ shareholders’ equity
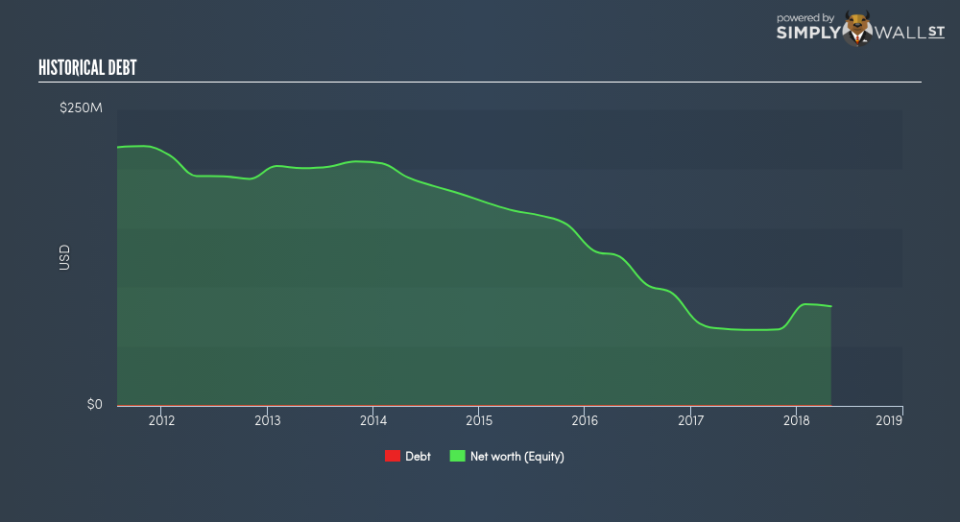
The first component is profit margin, which measures how much of sales is retained after the company pays for all its expenses. Asset turnover reveals how much revenue can be generated from SeaChange International’s asset base. The most interesting ratio, and reflective of sustainability of its ROE, is financial leverage. Since ROE can be artificially increased through excessive borrowing, we should check SeaChange International’s historic debt-to-equity ratio. Currently, SeaChange International has no debt which means its returns are driven purely by equity capital. Therefore, the level of financial leverage has no impact on ROE, and the ratio is a representative measure of the efficiency of all its capital employed firm-wide.
Next Steps:
While ROE is a relatively simple calculation, it can be broken down into different ratios, each telling a different story about the strengths and weaknesses of a company. SeaChange International’s above-industry ROE is encouraging, and is also in excess of its cost of equity. Its high ROE is not likely to be driven by high debt. Therefore, investors may have more confidence in the sustainability of this level of returns going forward. Although ROE can be a useful metric, it is only a small part of diligent research.
For SeaChange International, there are three essential factors you should look at:
Financial Health: Does it have a healthy balance sheet? Take a look at our free balance sheet analysis with six simple checks on key factors like leverage and risk.
Valuation: What is SeaChange International worth today? Is the stock undervalued, even when its growth outlook is factored into its intrinsic value? The intrinsic value infographic in our free research report helps visualize whether SeaChange International is currently mispriced by the market.
Other High-Growth Alternatives : Are there other high-growth stocks you could be holding instead of SeaChange International? Explore our interactive list of stocks with large growth potential to get an idea of what else is out there you may be missing!
To help readers see pass the short term volatility of the financial market, we aim to bring you a long-term focused research analysis purely driven by fundamental data. Note that our analysis does not factor in the latest price sensitive company announcements.
The author is an independent contributor and at the time of publication had no position in the stocks mentioned.
