
 Yahoo Finance
 SATS (SGX:S58) Is Reinvesting At Lower Rates Of Return
What are the early trends we should look for to identify a stock that could multiply in value over the long term? Amongst other things, we'll want to see two things; firstly, a growing return on capital employed (ROCE) and secondly, an expansion in the company's amount of capital employed. Ultimately, this demonstrates that it's a business that is reinvesting profits at increasing rates of return. Having said that, from a first glance at SATS (SGX:S58) we aren't jumping out of our chairs at how returns are trending, but let's have a deeper look.
Return On Capital Employed (ROCE): What Is It?
For those who don't know, ROCE is a measure of a company's yearly pre-tax profit (its return), relative to the capital employed in the business. The formula for this calculation on SATS is:
Return on Capital Employed = Earnings Before Interest and Tax (EBIT) ÷ (Total Assets - Current Liabilities)
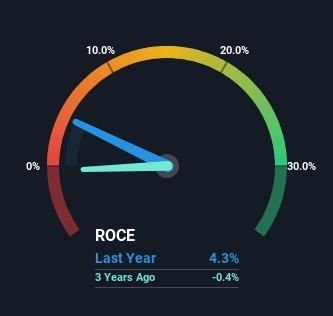
0.043 = S$244m ÷ (S$8.5b - S$2.8b) (Based on the trailing twelve months to March 2024).
So, SATS has an ROCE of 4.3%. Ultimately, that's a low return and it under-performs the Infrastructure industry average of 6.6%.
View our latest analysis for SATS
In the above chart we have measured SATS' prior ROCE against its prior performance, but the future is arguably more important. If you're interested, you can view the analysts predictions in our free analyst report for SATS .
What Does the ROCE Trend For SATS Tell Us?
On the surface, the trend of ROCE at SATS doesn't inspire confidence. Over the last five years, returns on capital have decreased to 4.3% from 12% five years ago. Although, given both revenue and the amount of assets employed in the business have increased, it could suggest the company is investing in growth, and the extra capital has led to a short-term reduction in ROCE. If these investments prove successful, this can bode very well for long term stock performance.
While on the subject, we noticed that the ratio of current liabilities to total assets has risen to 33%, which has impacted the ROCE. Without this increase, it's likely that ROCE would be even lower than 4.3%. While the ratio isn't currently too high, it's worth keeping an eye on this because if it gets particularly high, the business could then face some new elements of risk.
The Bottom Line
While returns have fallen for SATS in recent times, we're encouraged to see that sales are growing and that the business is reinvesting in its operations. However, despite the promising trends, the stock has fallen 36% over the last five years, so there might be an opportunity here for astute investors. So we think it'd be worthwhile to look further into this stock given the trends look encouraging.
One more thing, we've spotted 1 warning sign facing SATS that you might find interesting.
While SATS isn't earning the highest return, check out this free list of companies that are earning high returns on equity with solid balance sheets.
Have feedback on this article? Concerned about the content? Get in touch with us directly. Alternatively, email editorial-team (at) simplywallst.com.
This article by Simply Wall St is general in nature. We provide commentary based on historical data and analyst forecasts only using an unbiased methodology and our articles are not intended to be financial advice. It does not constitute a recommendation to buy or sell any stock, and does not take account of your objectives, or your financial situation. We aim to bring you long-term focused analysis driven by fundamental data. Note that our analysis may not factor in the latest price-sensitive company announcements or qualitative material. Simply Wall St has no position in any stocks mentioned.
