
 Yahoo Finance
 Sally Beauty (SBH) Q2 Earnings Miss Estimates, Sales Drop Y/Y
Sally Beauty Holdings, Inc. SBH reported dismal second-quarter fiscal 2024 results, with the top and the bottom line declining year over year. Earnings and net sales missed the Zacks Consensus Estimate.
Quarterly results were hurt by slowing traffic and shifting customer purchasing habits within the Sally Beauty segment, mainly due to the inflationary environment. Expanded distribution and product innovation offered respite.
Q2 in Detail
Sally Beauty’s adjusted earnings were 35 cents per share, missing the Zacks Consensus Estimate of 39 cents. The metric declined from 41 cents in the year-ago quarter.
Consolidated net sales of $908.4 million fell short of the Zacks Consensus Estimate of $908.5 million. The metric declined 1.1% year over year. Favorable currency rates increased net sales by 50 basis points.
Consolidated comparable sales dipped by 1.5%, mainly due to sluggish traffic and consumer spending trends at Sally Beauty, influenced by the inflationary landscape. However, this was somewhat mitigated by broader distribution channels, innovative product offerings, and a positive uptick in salon demand trends at Beauty Systems Group.
The company operated 16 fewer stores than the year-ago quarter. At constant currency rates, global e-commerce sales accounted for $90 million, representing 9.9% of the total consolidated net sales for the quarter.
Sally Beauty Holdings, Inc. Price, Consensus and EPS Surprise
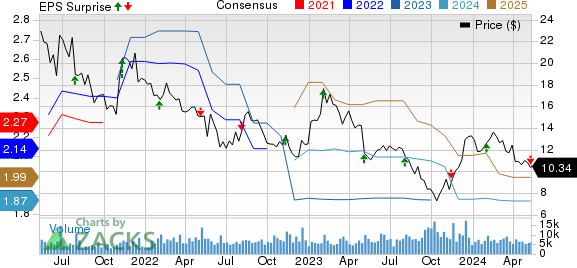
Sally Beauty Holdings, Inc. price-consensus-eps-surprise-chart | Sally Beauty Holdings, Inc. Quote
Consolidated gross profit came in at $463.1 million, down 1.1% from $468.3 million in the year-ago quarter. The adjusted gross margin expanded 30 basis points to 51%. The upside was primarily driven by reduced distribution and freight expenses resulting from supply chain efficiencies. However, this was partially offset by an unfavorable shift in the sales mix between Sally Beauty (which typically yields higher margins) and Beauty Systems Group (with comparatively lower margins).
Adjusted operating earnings were $68.6 million, down from $76.3 million in the year-ago quarter. The adjusted operating margin contracted from 8.3% to 7.6% in the fiscal second quarter.
Adjusted selling, general and administrative expenses were $394.5 million, up $4.8 million year over year. Elevated labor costs and rent expenses primarily fueled the increase. However, this was partly mitigated by a decrease in accrued bonus expenses. As a percentage of sales, the metric stood at 43.4% compared with 42.4% in the prior year.
Adjusted EBITDA came at $99.5 million, representing a decrease of 5.4% from the previous year. Additionally, the adjusted EBITDA margin stood at 11%, reflecting a decline of 50 basis points from the prior-year period’s tally.
Segmental Details
Sally Beauty Supply: Net sales in the segment fell 3.2% year over year to $513.2 million. Favorable foreign exchange had a positive impact of 90 bps on sales. Segment comparable sales saw a decline of 4% in the fiscal second quarter, primarily due to subdued traffic and customer spending patterns influenced by the inflationary environment. Net store count at the end of the quarter was 3,134, down by nine stores from the year-ago quarter’s level. Segmental e-commerce sales at cc stood at $34 million, contributing 6.6% to the segment’s net sales.
Beauty Systems Group: Net sales in the segment increased 1.7% year over year to $395.1 million. The segment’s comparable sales increased 2%, primarily driven by expanded distribution channels, innovative product offerings, and an improvement in salon demand trends. The net store count at the end of the quarter was 1,334, down by seven from the year-ago quarter. Total distributor sales consultants at the end of the quarter were 654 compared with 675 in the year-ago period. Segmental e-commerce sales at cc were $56 million, contributing 14.1% to the segment’s net sales.
Other Financial Aspects
SBH ended the fiscal first quarter with cash and cash equivalents of $97.2 million, long-term debt, including capital leases of $978.4 million, and total stockholders’ equity of $550.9 million.
In the fiscal second quarter, the company provided cash flow from operations of $36.9 million. Capital expenditure was $14.1 million for the period. Management expects capital expenditure of 100 million and an operating cash flow of nearly $240 million in the fiscal 2024. In the fiscal second quarter, the company repurchased 1.5 million shares as part of its share repurchase program.
FY24 Outlook
For the fiscal 2024, management expects net sales and comparable sales to be almost flat year over year. The gross margin is anticipated to be 50.5-51%, with an adjusted operating margin of almost 8.5%.
The Zacks Rank #4 (Sell) company’s shares have declined 24.9% in the past three months compared with the industry’s 2.5% fall.
Top 3 Picks
Tractor Supply Company TSCO, which operates as a rural lifestyle retailer in the United States, currently carries a Zacks Rank #2 (Buy). Tractor Supply has a trailing four-quarter earnings surprise of 2.7%, on average. You can see the complete list of today’s Zacks #1 Rank (Strong Buy) stocks here.
The Zacks Consensus Estimate for Tractor Supply’s current financial-year sales and earnings suggests growth of 3% and 2.3%, respectively, from the year-ago reported numbers.
Bath & Body Works, Inc. BBWI carries a Zacks Rank #2. BBWI has a trailing four-quarter earnings surprise of 23.2%, on average.
The Zacks Consensus Estimate for Bath & Body Works’ current fiscal year earnings indicates growth of 0.9% from the year-ago period’s levels.
American Eagle Outfitters Inc. AEO is a specialty retailer of casual apparel, accessories and footwear. The company currently has a Zacks Rank #2.
The Zacks Consensus Estimate for American Eagle’s current fiscal-year earnings and sales indicates growth of 12.5% and 3.4%, respectively, from the year-ago period’s reported figures. AEO has a trailing four-quarter average earnings surprise of 22.7%.
Want the latest recommendations from Zacks Investment Research? Today, you can download 7 Best Stocks for the Next 30 Days. Click to get this free report
American Eagle Outfitters, Inc. (AEO) : Free Stock Analysis Report
Tractor Supply Company (TSCO) : Free Stock Analysis Report
Sally Beauty Holdings, Inc. (SBH) : Free Stock Analysis Report
Bath & Body Works, Inc. (BBWI) : Free Stock Analysis Report
