
 Yahoo Finance
 Returns At Vicplas International (SGX:569) Are On The Way Up
There are a few key trends to look for if we want to identify the next multi-bagger. Firstly, we'll want to see a proven return on capital employed (ROCE) that is increasing, and secondly, an expanding base of capital employed. This shows us that it's a compounding machine, able to continually reinvest its earnings back into the business and generate higher returns. Speaking of which, we noticed some great changes in Vicplas International's (SGX:569) returns on capital, so let's have a look.
Understanding Return On Capital Employed (ROCE)
For those that aren't sure what ROCE is, it measures the amount of pre-tax profits a company can generate from the capital employed in its business. Analysts use this formula to calculate it for Vicplas International:
Return on Capital Employed = Earnings Before Interest and Tax (EBIT) ÷ (Total Assets - Current Liabilities)
0.091 = S$8.3m ÷ (S$119m - S$27m) (Based on the trailing twelve months to July 2023).
So, Vicplas International has an ROCE of 9.1%. Even though it's in line with the industry average of 9.5%, it's still a low return by itself.
Check out our latest analysis for Vicplas International
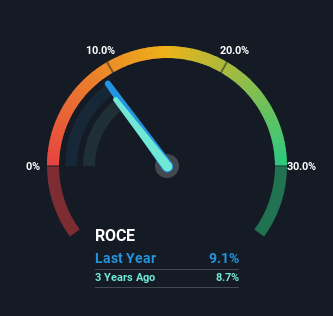
Historical performance is a great place to start when researching a stock so above you can see the gauge for Vicplas International's ROCE against it's prior returns. If you're interested in investigating Vicplas International's past further, check out this free graph of past earnings, revenue and cash flow.
The Trend Of ROCE
While in absolute terms it isn't a high ROCE, it's promising to see that it has been moving in the right direction. The data shows that returns on capital have increased substantially over the last five years to 9.1%. The amount of capital employed has increased too, by 52%. So we're very much inspired by what we're seeing at Vicplas International thanks to its ability to profitably reinvest capital.
In Conclusion...
A company that is growing its returns on capital and can consistently reinvest in itself is a highly sought after trait, and that's what Vicplas International has. Since the stock has returned a solid 60% to shareholders over the last five years, it's fair to say investors are beginning to recognize these changes. Therefore, we think it would be worth your time to check if these trends are going to continue.
On a separate note, we've found 4 warning signs for Vicplas International you'll probably want to know about.
For those who like to invest in solid companies, check out this free list of companies with solid balance sheets and high returns on equity.
Have feedback on this article? Concerned about the content? Get in touch with us directly. Alternatively, email editorial-team (at) simplywallst.com.
This article by Simply Wall St is general in nature. We provide commentary based on historical data and analyst forecasts only using an unbiased methodology and our articles are not intended to be financial advice. It does not constitute a recommendation to buy or sell any stock, and does not take account of your objectives, or your financial situation. We aim to bring you long-term focused analysis driven by fundamental data. Note that our analysis may not factor in the latest price-sensitive company announcements or qualitative material. Simply Wall St has no position in any stocks mentioned.