
 Yahoo Finance
 Returns At QAF (SGX:Q01) Are On The Way Up
What trends should we look for it we want to identify stocks that can multiply in value over the long term? One common approach is to try and find a company with returns on capital employed (ROCE) that are increasing, in conjunction with a growing amount of capital employed. Put simply, these types of businesses are compounding machines, meaning they are continually reinvesting their earnings at ever-higher rates of return. Speaking of which, we noticed some great changes in QAF's (SGX:Q01) returns on capital, so let's have a look.
Understanding Return On Capital Employed (ROCE)
For those who don't know, ROCE is a measure of a company's yearly pre-tax profit (its return), relative to the capital employed in the business. To calculate this metric for QAF, this is the formula:
Return on Capital Employed = Earnings Before Interest and Tax (EBIT) ÷ (Total Assets - Current Liabilities)
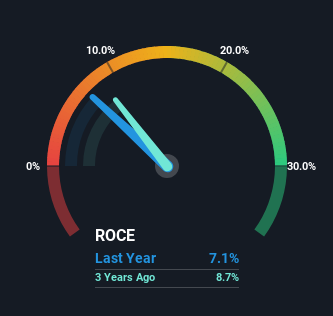
0.071 = S$38m ÷ (S$669m - S$142m) (Based on the trailing twelve months to December 2023).
Thus, QAF has an ROCE of 7.1%. On its own, that's a low figure but it's around the 7.6% average generated by the Food industry.
View our latest analysis for QAF
While the past is not representative of the future, it can be helpful to know how a company has performed historically, which is why we have this chart above. If you'd like to look at how QAF has performed in the past in other metrics, you can view this free graph of QAF's past earnings, revenue and cash flow.
What The Trend Of ROCE Can Tell Us
QAF is showing promise given that its ROCE is trending up and to the right. The figures show that over the last five years, ROCE has grown 498% whilst employing roughly the same amount of capital. So it's likely that the business is now reaping the full benefits of its past investments, since the capital employed hasn't changed considerably. On that front, things are looking good so it's worth exploring what management has said about growth plans going forward.
Our Take On QAF's ROCE
To sum it up, QAF is collecting higher returns from the same amount of capital, and that's impressive. Since the stock has only returned 38% to shareholders over the last five years, the promising fundamentals may not be recognized yet by investors. Given that, we'd look further into this stock in case it has more traits that could make it multiply in the long term.
If you want to know some of the risks facing QAF we've found 2 warning signs (1 can't be ignored!) that you should be aware of before investing here.
For those who like to invest in solid companies, check out this free list of companies with solid balance sheets and high returns on equity.
Have feedback on this article? Concerned about the content? Get in touch with us directly. Alternatively, email editorial-team (at) simplywallst.com.
This article by Simply Wall St is general in nature. We provide commentary based on historical data and analyst forecasts only using an unbiased methodology and our articles are not intended to be financial advice. It does not constitute a recommendation to buy or sell any stock, and does not take account of your objectives, or your financial situation. We aim to bring you long-term focused analysis driven by fundamental data. Note that our analysis may not factor in the latest price-sensitive company announcements or qualitative material. Simply Wall St has no position in any stocks mentioned.
