
 Yahoo Finance
 Returns At Q & M Dental Group (Singapore) (SGX:QC7) Are On The Way Up
What trends should we look for it we want to identify stocks that can multiply in value over the long term? Ideally, a business will show two trends; firstly a growing return on capital employed (ROCE) and secondly, an increasing amount of capital employed. Put simply, these types of businesses are compounding machines, meaning they are continually reinvesting their earnings at ever-higher rates of return. So on that note, Q & M Dental Group (Singapore) (SGX:QC7) looks quite promising in regards to its trends of return on capital.
Understanding Return On Capital Employed (ROCE)
If you haven't worked with ROCE before, it measures the 'return' (pre-tax profit) a company generates from capital employed in its business. The formula for this calculation on Q & M Dental Group (Singapore) is:
Return on Capital Employed = Earnings Before Interest and Tax (EBIT) ÷ (Total Assets - Current Liabilities)
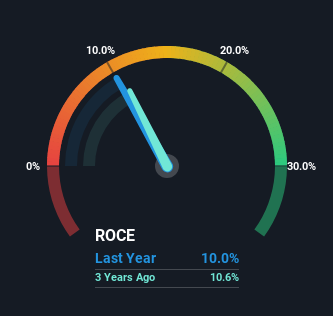
0.10 = S$23m ÷ (S$259m - S$33m) (Based on the trailing twelve months to December 2023).
Therefore, Q & M Dental Group (Singapore) has an ROCE of 10%. On its own, that's a standard return, however it's much better than the 7.0% generated by the Healthcare industry.
Check out our latest analysis for Q & M Dental Group (Singapore)
Above you can see how the current ROCE for Q & M Dental Group (Singapore) compares to its prior returns on capital, but there's only so much you can tell from the past. If you'd like, you can check out the forecasts from the analysts covering Q & M Dental Group (Singapore) for free.
How Are Returns Trending?
Q & M Dental Group (Singapore)'s ROCE growth is quite impressive. The figures show that over the last five years, ROCE has grown 58% whilst employing roughly the same amount of capital. So it's likely that the business is now reaping the full benefits of its past investments, since the capital employed hasn't changed considerably. It's worth looking deeper into this though because while it's great that the business is more efficient, it might also mean that going forward the areas to invest internally for the organic growth are lacking.
In Conclusion...
To sum it up, Q & M Dental Group (Singapore) is collecting higher returns from the same amount of capital, and that's impressive. And since the stock has fallen 20% over the last five years, there might be an opportunity here. That being the case, research into the company's current valuation metrics and future prospects seems fitting.
If you'd like to know about the risks facing Q & M Dental Group (Singapore), we've discovered 2 warning signs that you should be aware of.
For those who like to invest in solid companies, check out this free list of companies with solid balance sheets and high returns on equity.
Have feedback on this article? Concerned about the content? Get in touch with us directly. Alternatively, email editorial-team (at) simplywallst.com.
This article by Simply Wall St is general in nature. We provide commentary based on historical data and analyst forecasts only using an unbiased methodology and our articles are not intended to be financial advice. It does not constitute a recommendation to buy or sell any stock, and does not take account of your objectives, or your financial situation. We aim to bring you long-term focused analysis driven by fundamental data. Note that our analysis may not factor in the latest price-sensitive company announcements or qualitative material. Simply Wall St has no position in any stocks mentioned.
