
 Yahoo Finance
 The Returns At Hock Lian Seng Holdings (SGX:J2T) Aren't Growing
There are a few key trends to look for if we want to identify the next multi-bagger. Firstly, we'll want to see a proven return on capital employed (ROCE) that is increasing, and secondly, an expanding base of capital employed. Basically this means that a company has profitable initiatives that it can continue to reinvest in, which is a trait of a compounding machine. However, after briefly looking over the numbers, we don't think Hock Lian Seng Holdings (SGX:J2T) has the makings of a multi-bagger going forward, but let's have a look at why that may be.
What Is Return On Capital Employed (ROCE)?
Just to clarify if you're unsure, ROCE is a metric for evaluating how much pre-tax income (in percentage terms) a company earns on the capital invested in its business. The formula for this calculation on Hock Lian Seng Holdings is:
Return on Capital Employed = Earnings Before Interest and Tax (EBIT) ÷ (Total Assets - Current Liabilities)
0.066 = S$17m ÷ (S$341m - S$81m) (Based on the trailing twelve months to December 2023).
Therefore, Hock Lian Seng Holdings has an ROCE of 6.6%. In absolute terms, that's a low return but it's around the Construction industry average of 8.0%.
Check out our latest analysis for Hock Lian Seng Holdings
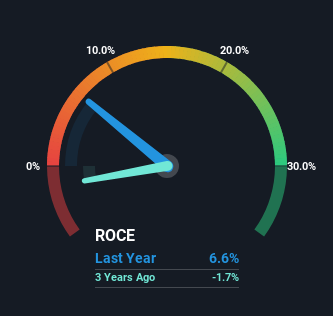
Historical performance is a great place to start when researching a stock so above you can see the gauge for Hock Lian Seng Holdings' ROCE against it's prior returns. If you want to delve into the historical earnings , check out these free graphs detailing revenue and cash flow performance of Hock Lian Seng Holdings.
So How Is Hock Lian Seng Holdings' ROCE Trending?
The returns on capital haven't changed much for Hock Lian Seng Holdings in recent years. The company has consistently earned 6.6% for the last five years, and the capital employed within the business has risen 28% in that time. Given the company has increased the amount of capital employed, it appears the investments that have been made simply don't provide a high return on capital.
On a side note, Hock Lian Seng Holdings has done well to reduce current liabilities to 24% of total assets over the last five years. This can eliminate some of the risks inherent in the operations because the business has less outstanding obligations to their suppliers and or short-term creditors than they did previously.
Our Take On Hock Lian Seng Holdings' ROCE
Long story short, while Hock Lian Seng Holdings has been reinvesting its capital, the returns that it's generating haven't increased. And with the stock having returned a mere 7.0% in the last five years to shareholders, you could argue that they're aware of these lackluster trends. So if you're looking for a multi-bagger, the underlying trends indicate you may have better chances elsewhere.
Hock Lian Seng Holdings does have some risks, we noticed 2 warning signs (and 1 which is concerning) we think you should know about.
If you want to search for solid companies with great earnings, check out this free list of companies with good balance sheets and impressive returns on equity.
Have feedback on this article? Concerned about the content? Get in touch with us directly. Alternatively, email editorial-team (at) simplywallst.com.
This article by Simply Wall St is general in nature. We provide commentary based on historical data and analyst forecasts only using an unbiased methodology and our articles are not intended to be financial advice. It does not constitute a recommendation to buy or sell any stock, and does not take account of your objectives, or your financial situation. We aim to bring you long-term focused analysis driven by fundamental data. Note that our analysis may not factor in the latest price-sensitive company announcements or qualitative material. Simply Wall St has no position in any stocks mentioned.
