
 Yahoo Finance
 Returns Are Gaining Momentum At Second Chance Properties (SGX:528)
To find a multi-bagger stock, what are the underlying trends we should look for in a business? Ideally, a business will show two trends; firstly a growing return on capital employed (ROCE) and secondly, an increasing amount of capital employed. Put simply, these types of businesses are compounding machines, meaning they are continually reinvesting their earnings at ever-higher rates of return. With that in mind, we've noticed some promising trends at Second Chance Properties (SGX:528) so let's look a bit deeper.
What Is Return On Capital Employed (ROCE)?
Just to clarify if you're unsure, ROCE is a metric for evaluating how much pre-tax income (in percentage terms) a company earns on the capital invested in its business. To calculate this metric for Second Chance Properties, this is the formula:
Return on Capital Employed = Earnings Before Interest and Tax (EBIT) ÷ (Total Assets - Current Liabilities)
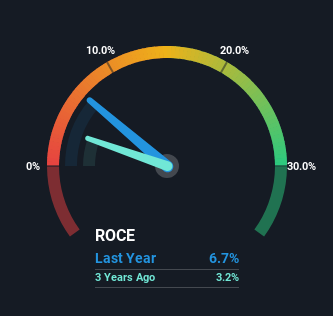
0.067 = S$19m ÷ (S$378m - S$95m) (Based on the trailing twelve months to August 2023).
So, Second Chance Properties has an ROCE of 6.7%. Ultimately, that's a low return and it under-performs the Specialty Retail industry average of 12%.
See our latest analysis for Second Chance Properties
While the past is not representative of the future, it can be helpful to know how a company has performed historically, which is why we have this chart above. If you want to delve into the historical earnings , check out these free graphs detailing revenue and cash flow performance of Second Chance Properties.
What Can We Tell From Second Chance Properties' ROCE Trend?
Second Chance Properties has not disappointed with their ROCE growth. The figures show that over the last five years, ROCE has grown 90% whilst employing roughly the same amount of capital. So it's likely that the business is now reaping the full benefits of its past investments, since the capital employed hasn't changed considerably. The company is doing well in that sense, and it's worth investigating what the management team has planned for long term growth prospects.
On a side note, we noticed that the improvement in ROCE appears to be partly fueled by an increase in current liabilities. The current liabilities has increased to 25% of total assets, so the business is now more funded by the likes of its suppliers or short-term creditors. It's worth keeping an eye on this because as the percentage of current liabilities to total assets increases, some aspects of risk also increase.
The Bottom Line
As discussed above, Second Chance Properties appears to be getting more proficient at generating returns since capital employed has remained flat but earnings (before interest and tax) are up. Considering the stock has delivered 38% to its stockholders over the last five years, it may be fair to think that investors aren't fully aware of the promising trends yet. So exploring more about this stock could uncover a good opportunity, if the valuation and other metrics stack up.
On the other side of ROCE, we have to consider valuation. That's why we have a FREE intrinsic value estimation for 528 on our platform that is definitely worth checking out.
If you want to search for solid companies with great earnings, check out this free list of companies with good balance sheets and impressive returns on equity.
Have feedback on this article? Concerned about the content? Get in touch with us directly. Alternatively, email editorial-team (at) simplywallst.com.
This article by Simply Wall St is general in nature. We provide commentary based on historical data and analyst forecasts only using an unbiased methodology and our articles are not intended to be financial advice. It does not constitute a recommendation to buy or sell any stock, and does not take account of your objectives, or your financial situation. We aim to bring you long-term focused analysis driven by fundamental data. Note that our analysis may not factor in the latest price-sensitive company announcements or qualitative material. Simply Wall St has no position in any stocks mentioned.
