
 Yahoo Finance
 Returns Are Gaining Momentum At iHuman (NYSE:IH)
Did you know there are some financial metrics that can provide clues of a potential multi-bagger? Firstly, we'll want to see a proven return on capital employed (ROCE) that is increasing, and secondly, an expanding base of capital employed. This shows us that it's a compounding machine, able to continually reinvest its earnings back into the business and generate higher returns. Speaking of which, we noticed some great changes in iHuman's (NYSE:IH) returns on capital, so let's have a look.
Understanding Return On Capital Employed (ROCE)
If you haven't worked with ROCE before, it measures the 'return' (pre-tax profit) a company generates from capital employed in its business. To calculate this metric for iHuman, this is the formula:
Return on Capital Employed = Earnings Before Interest and Tax (EBIT) ÷ (Total Assets - Current Liabilities)
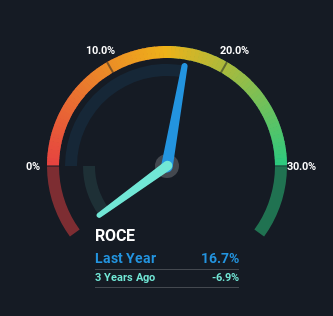
0.17 = CN¥160m ÷ (CN¥1.5b - CN¥491m) (Based on the trailing twelve months to December 2023).
Therefore, iHuman has an ROCE of 17%. In absolute terms, that's a satisfactory return, but compared to the Entertainment industry average of 11% it's much better.
Check out our latest analysis for iHuman
While the past is not representative of the future, it can be helpful to know how a company has performed historically, which is why we have this chart above. If you're interested in investigating iHuman's past further, check out this free graph covering iHuman's past earnings, revenue and cash flow.
The Trend Of ROCE
The fact that iHuman is now generating some pre-tax profits from its prior investments is very encouraging. The company was generating losses three years ago, but now it's earning 17% which is a sight for sore eyes. And unsurprisingly, like most companies trying to break into the black, iHuman is utilizing 48% more capital than it was three years ago. This can indicate that there's plenty of opportunities to invest capital internally and at ever higher rates, both common traits of a multi-bagger.
Our Take On iHuman's ROCE
Overall, iHuman gets a big tick from us thanks in most part to the fact that it is now profitable and is reinvesting in its business. Although the company may be facing some issues elsewhere since the stock has plunged 77% in the last three years. Still, it's worth doing some further research to see if the trends will continue into the future.
While iHuman looks impressive, no company is worth an infinite price. The intrinsic value infographic for IH helps visualize whether it is currently trading for a fair price.
If you want to search for solid companies with great earnings, check out this free list of companies with good balance sheets and impressive returns on equity.
Have feedback on this article? Concerned about the content? Get in touch with us directly. Alternatively, email editorial-team (at) simplywallst.com.
This article by Simply Wall St is general in nature. We provide commentary based on historical data and analyst forecasts only using an unbiased methodology and our articles are not intended to be financial advice. It does not constitute a recommendation to buy or sell any stock, and does not take account of your objectives, or your financial situation. We aim to bring you long-term focused analysis driven by fundamental data. Note that our analysis may not factor in the latest price-sensitive company announcements or qualitative material. Simply Wall St has no position in any stocks mentioned.
