
 Yahoo Finance
 The Returns At Fraser and Neave (SGX:F99) Aren't Growing
If you're looking for a multi-bagger, there's a few things to keep an eye out for. In a perfect world, we'd like to see a company investing more capital into its business and ideally the returns earned from that capital are also increasing. Put simply, these types of businesses are compounding machines, meaning they are continually reinvesting their earnings at ever-higher rates of return. In light of that, when we looked at Fraser and Neave (SGX:F99) and its ROCE trend, we weren't exactly thrilled.
Understanding Return On Capital Employed (ROCE)
Just to clarify if you're unsure, ROCE is a metric for evaluating how much pre-tax income (in percentage terms) a company earns on the capital invested in its business. The formula for this calculation on Fraser and Neave is:
Return on Capital Employed = Earnings Before Interest and Tax (EBIT) ÷ (Total Assets - Current Liabilities)
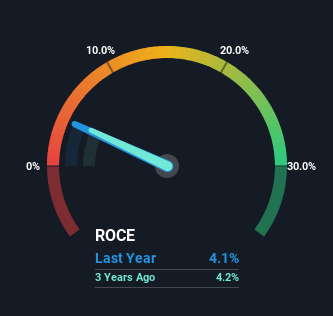
0.041 = S$178m ÷ (S$5.1b - S$734m) (Based on the trailing twelve months to December 2023).
Thus, Fraser and Neave has an ROCE of 4.1%. In absolute terms, that's a low return and it also under-performs the Food industry average of 7.6%.
View our latest analysis for Fraser and Neave
While the past is not representative of the future, it can be helpful to know how a company has performed historically, which is why we have this chart above. If you're interested in investigating Fraser and Neave's past further, check out this free graph covering Fraser and Neave's past earnings, revenue and cash flow.
The Trend Of ROCE
Over the past five years, Fraser and Neave's ROCE and capital employed have both remained mostly flat. Businesses with these traits tend to be mature and steady operations because they're past the growth phase. So unless we see a substantial change at Fraser and Neave in terms of ROCE and additional investments being made, we wouldn't hold our breath on it being a multi-bagger.
Our Take On Fraser and Neave's ROCE
In a nutshell, Fraser and Neave has been trudging along with the same returns from the same amount of capital over the last five years. And investors appear hesitant that the trends will pick up because the stock has fallen 29% in the last five years. On the whole, we aren't too inspired by the underlying trends and we think there may be better chances of finding a multi-bagger elsewhere.
Fraser and Neave does have some risks, we noticed 2 warning signs (and 1 which doesn't sit too well with us) we think you should know about.
While Fraser and Neave may not currently earn the highest returns, we've compiled a list of companies that currently earn more than 25% return on equity. Check out this free list here.
Have feedback on this article? Concerned about the content? Get in touch with us directly. Alternatively, email editorial-team (at) simplywallst.com.
This article by Simply Wall St is general in nature. We provide commentary based on historical data and analyst forecasts only using an unbiased methodology and our articles are not intended to be financial advice. It does not constitute a recommendation to buy or sell any stock, and does not take account of your objectives, or your financial situation. We aim to bring you long-term focused analysis driven by fundamental data. Note that our analysis may not factor in the latest price-sensitive company announcements or qualitative material. Simply Wall St has no position in any stocks mentioned.
