
 Yahoo Finance
 Returns On Capital Are A Standout For Teekay Tankers (NYSE:TNK)
If we want to find a stock that could multiply over the long term, what are the underlying trends we should look for? Ideally, a business will show two trends; firstly a growing return on capital employed (ROCE) and secondly, an increasing amount of capital employed. This shows us that it's a compounding machine, able to continually reinvest its earnings back into the business and generate higher returns. So when we looked at the ROCE trend of Teekay Tankers (NYSE:TNK) we really liked what we saw.
Return On Capital Employed (ROCE): What Is It?
For those who don't know, ROCE is a measure of a company's yearly pre-tax profit (its return), relative to the capital employed in the business. To calculate this metric for Teekay Tankers, this is the formula:
Return on Capital Employed = Earnings Before Interest and Tax (EBIT) ÷ (Total Assets - Current Liabilities)
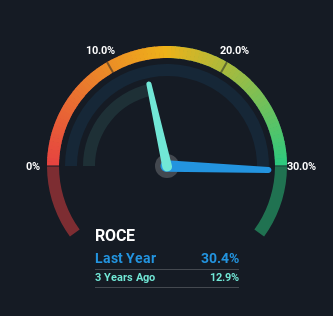
0.30 = US$527m ÷ (US$1.9b - US$139m) (Based on the trailing twelve months to December 2023).
Therefore, Teekay Tankers has an ROCE of 30%. That's a fantastic return and not only that, it outpaces the average of 15% earned by companies in a similar industry.
Check out our latest analysis for Teekay Tankers
In the above chart we have measured Teekay Tankers' prior ROCE against its prior performance, but the future is arguably more important. If you're interested, you can view the analysts predictions in our free analyst report for Teekay Tankers .
So How Is Teekay Tankers' ROCE Trending?
Teekay Tankers has not disappointed with their ROCE growth. More specifically, while the company has kept capital employed relatively flat over the last five years, the ROCE has climbed 7,148% in that same time. Basically the business is generating higher returns from the same amount of capital and that is proof that there are improvements in the company's efficiencies. The company is doing well in that sense, and it's worth investigating what the management team has planned for long term growth prospects.
Our Take On Teekay Tankers' ROCE
In summary, we're delighted to see that Teekay Tankers has been able to increase efficiencies and earn higher rates of return on the same amount of capital. Since the stock has returned a staggering 606% to shareholders over the last five years, it looks like investors are recognizing these changes. So given the stock has proven it has promising trends, it's worth researching the company further to see if these trends are likely to persist.
If you'd like to know more about Teekay Tankers, we've spotted 2 warning signs, and 1 of them is potentially serious.
If you want to search for more stocks that have been earning high returns, check out this free list of stocks with solid balance sheets that are also earning high returns on equity.
Have feedback on this article? Concerned about the content? Get in touch with us directly. Alternatively, email editorial-team (at) simplywallst.com.
This article by Simply Wall St is general in nature. We provide commentary based on historical data and analyst forecasts only using an unbiased methodology and our articles are not intended to be financial advice. It does not constitute a recommendation to buy or sell any stock, and does not take account of your objectives, or your financial situation. We aim to bring you long-term focused analysis driven by fundamental data. Note that our analysis may not factor in the latest price-sensitive company announcements or qualitative material. Simply Wall St has no position in any stocks mentioned.
